Technical Analysis Review: EUR/USD Faces Potential Downward Pressure Amid Neutral Signals – 07/05/2025
Tháng 5 6, 2025
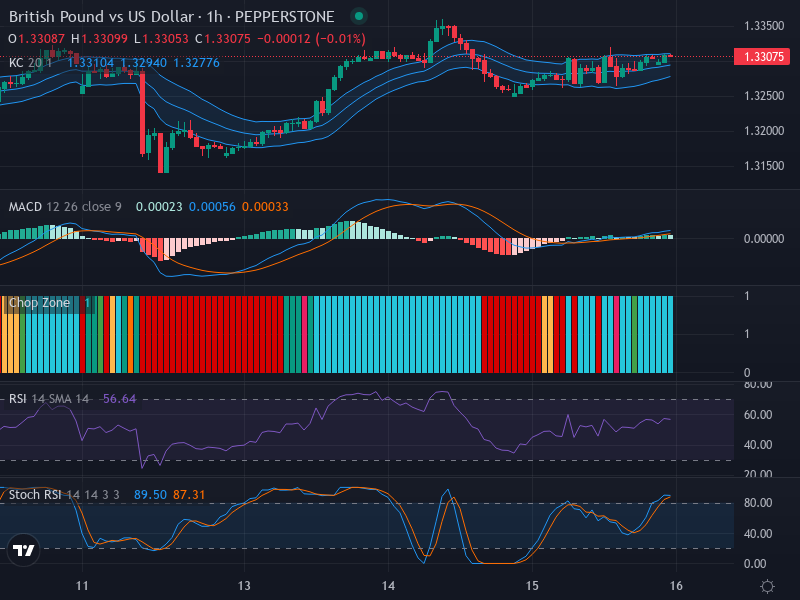
Analyzing Potential for Bullish Continuation – GBP/USD at a Glance – 07/05/2025
Tháng 5 6, 2025Market Overview
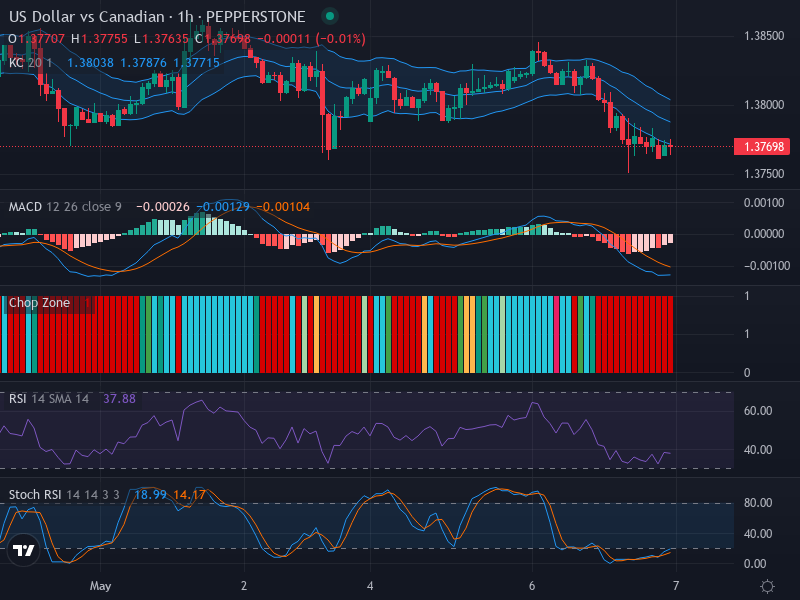
As we delve into the conditions of the Forex market for the US dollar against the Canadian dollar (USD/CAD), an analysis of the current price reveals a predominant downward trend. The pair is presently trading at 1.37698.
This examination takes into account various technical points such as the candlestick patterns, crucial support and resistance levels, and the narratives provided by indicators like the Relative Strength Index (RSI), Stochastic RSI, and Moving Average Convergence Divergence (MACD).
Technical Analysis
Observation of the candlestick pattern presents a compelling narrative, with the market direction asserting a downward stance over the USD/CAD pair. No significant bullish reversal patterns, such as bullish engulfing, are noticeable on the chart, further fortifying the continuity of the downtrend. For potential future market actions, anticipate the price to potentially hit a support level approximately at 1.3750.
In terms of the Relative Strength Index (RSI), the value is currently at 37.88, which teeters close to oversold conditions. This indicates limited buying pressure, providing additional credence to the current bearish sentiment in the market. No notable divergence has been spotted on the RSI, maintaining equilibrium between the price action and the RSI’s movements.
Furthermore, the Stochastic RSI reveals interesting developments. The value of K and D lines stands at 18.99 and 14.17 respectively. With the K line poised to cross above the D line, it hints towards a short-lived upward adjustment in price. While this temporary deviation mildly opposes the overarching bearish trend, it opens up short-term buying opportunities for traders.
The Moving Average Convergence Divergence (MACD) analysis concurrently shows the MACD line positioned slightly below the signal line, denoting a bearish crossover. The accompanying negative histogram momentum reinforces this bearish outlook, signaling a potential good entry for short positions.
Conclusion and Trading Recommendations
Considering the sustained downward trend, absence of strong bullish reversal patterns, and the indicators’ support for the bearish narrative, traders should anticipate the market’s bearishness to persist. However, a minor short-term upward correction may be on the horizon due to Stochastic RSI signals.
Under these circumstances, it’s recommended to tactically implement a sell-oriented stance, capitalizing on the prevailing downtrend while mitigating risks. Prioritize the setup for short positions, keeping an eye out for short-term buying opportunities that may stem from these temporary upward corrections.
Trend Analysis
In terms of different time frames:
- The 1-week shows a consistent downward trend, confirming the overall bearish narrative.
- The 1-day trend indicates some potential consolidation, yet remains downward.
- The 4-hour suggests temporary ups and downs, with a likely continuation of the bearish movement.
Entry Points and Risk Management
After analyzing these indicators and the overall trend, potential entry points are identified as follows:
- Buy Entry Point: 1.3785, Take Profit: 1.3805, Stop Loss: 1.3760.
- Sell Entry Point: 1.3765, Take Profit: 1.3745, Stop Loss: 1.3780.
Given the current market conditions and analysis, a Sell scenario appears to be more likely to occur. This approach ensures that traders can take advantage of ongoing bearish momentum while remaining vigilant for any signs of reversal that may arise.