NYPD Officers Ambushed in Times Square: A Disturbing Reality of Gang Violence
Tháng 5 6, 2025
USD/CAD Forex Market: Technical Analysis and Trading Recommendations – 07/05/2025
Tháng 5 6, 2025Market Overview
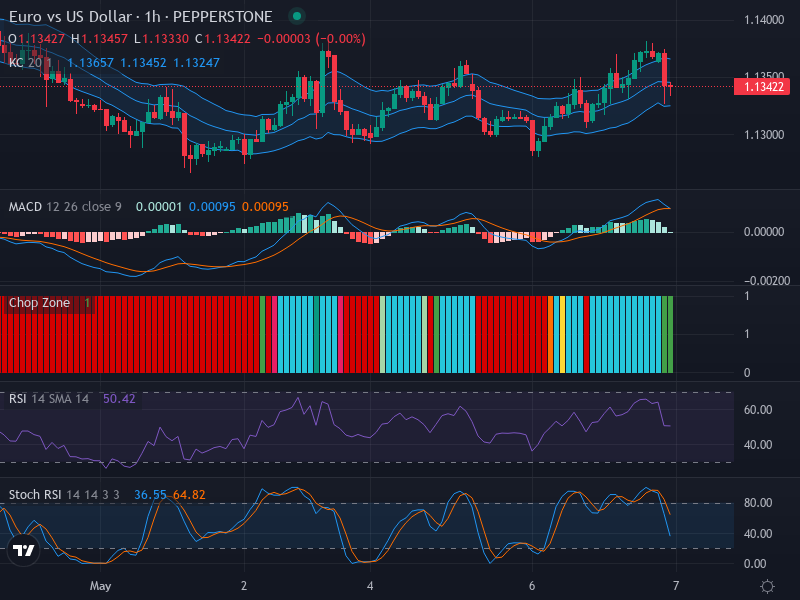
The EUR/USD is currently exhibiting lateral movement, as the market meanders in uncertain territory against the backdrop of geopolitical and economic drama around the globe. The currency pair is being traded at 1.13422 and operates within a narrow range bracketed by resistance and support levels at 1.13650 and 1.13330, respectively. Observations from a series of different technical indicators evoke mixed sentiments.
Technical Analysis
At first glance, the broader analysis would appear to depict a modest standoff between the bulls and the bears, with neither side seeming to hold a definitive edge. There is a bearish candlestick formation hinting at potential declining pressure in the short run, which might undermine the current equilibrium momentarily. However, the market as a whole carries an air of neutrality, largely reflected by the movement of key indicators.
In tune with the aforementioned lateral momentum, the Relative Strength Index (RSI) stands at 50.42, embodying the state of equilibrium between buyers and sellers. This unclear market bias doesn’t offer much momentum to either side, paving the way for a potential tug-of-war between bullish and bearish factions in the coming trading sessions.
Throwing light on the sentiment highlighted by the Stochastic RSI, it seems that the pair’s lack of direction might soon face a challenge. The Stochastic RSI K line has dipped below the D line, trending at a modest 36.55 versus 64.82. This crossover indicates the potential for downward momentum, supporting the bearish sentiment put forward by the recent candlestick formation.
Considering the Moving Average Convergence Divergence (MACD), it too is indicating a state of limbo. The MACD line sits meagerly above the Signal Line at 0.00001, thus portraying a weak bullish crossover. Meanwhile, the histogram exhibits neutral momentum, an echo of the overarching sideways movement of the pair.
Conclusion and Trading Recommendations
The present EUR/USD landscape presents a cocktail of neutral standing and potential bearish sentiment. Traders should tread lightly and remain vigilant for signs of stronger direction. The combination of bearish candlestick patterns, a potentially boding Stochastic RSI crossover, and overall sideways orientation call for cautious positioning.
Investors might want to consider closing long positions and reassessing whether shorting the currency pair could be a tactical move, given the bearish undertone. Alternatively, one might opt to stay on the sidelines until more significant bullish or bearish momentum becomes evident.
Trend Analysis by Time Frame
The analysis of the following time frames reveals important insights into potential market movements:
- 1-Week Time Frame: The overall momentum remains neutral with slight bearish pressures, suggesting the potential for further declines.
- 1-Day Time Frame: Daily analysis shows a marked bearish sentiment emerging, pushing the price towards support levels.
- 4-Hour Time Frame: The mid-term perspective indicates the price is struggling around resistance, further reinforcing the likelihood of downward movement.
Potential Entry Points
Considering the analyses across different time frames, potential entry points can be established as follows:
- Buy Entry Point: 1.13500, Take Profit Point: 1.13750, Stop Loss Point: 1.13250.
- Sell Entry Point: 1.13300, Take Profit Point: 1.13000, Stop Loss Point: 1.13450.
In conclusion, with the recent indicators consistently pointing towards bearish tendencies, a Sell scenario appears more likely to unfold in the near term. Traders should focus on the indicated sell entry point while managing their risk with the provided stop loss.