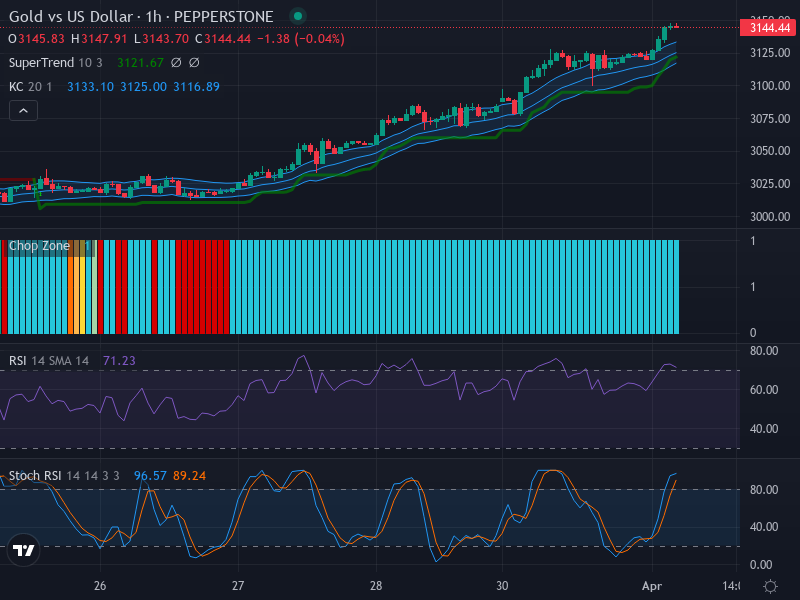
Gold vs US Dollar – An Upward Momentum with Potential Resistance at 3140 Ounce – 01/04/2025
Tháng 3 31, 2025
The Forex Dance of GBP/USD: An Analysis of Market Stability and Indecision – 01/04/2025
Tháng 4 1, 2025Market Overview
Gold has been exhibiting an upward trend against the US Dollar, as detailed in our technical analysis report. This positive shift in the market has emerged due to several robust indicators and engaging technical analysis focus points. The purpose of this article is to delve into the details of these findings, revealing the remarkable bullish trend that is impacting the market and the implications it holds for traders.
Technical Analysis
The current Gold versus US Dollar forex chart has exhibited a predominantly bullish trend. This is denoted by the consistent presence of green candlesticks. While the pattern lacks a definitive simple candlestick pattern such as a bullish engulfing, the constant manifestation of higher highs suggests a sturdy upward momentum. This is notable, especially in the surge zones near the pinnacle of the Keltner Channel, idling around the 3145 hallmark.
When examining the Relative Strength Index (RSI), the market communicates an overbought condition with an RSI value of 71.23. This condition correlates with the upward trend, raising potential wariness for new long positions; however, it does not directly infer an immediate reversal. The market is currently devoid of clear divergence between RSI values and price movement.
The scrutiny of the Stochastic RSI (Stoch RSI) reveals that both the K and the D lines are within the overbought region, with values of 96.57 and 89.24 respectively. With the K line positioned above the D line, the presence of a potential crossover confirms the sustained bullish momentum. Despite the prevailing uptrend, this also indicates an upcoming cooling-off period, a much-needed breather for the market.
The Keltner Channels and Chop Zone provide meaningful insights into the current trend. The price remains positioned above the middle band of the Keltner Channel, which aligns with a protracted uptrend. However, the expanded state of the channel indicates a high volatility environment. The Chop Zone’s input will be valuable in understanding this market picture further.
Conclusion and Trading Recommendations
Leveraging the above interpretations, the Gold versus the US Dollar market exhibits strong bullish momentum, reflected through numerous technical indicators. This sustained upward trend suggests potential profitability for traders who seize long positions. However, due to the overbought situations revealed by RSI and Stoch RSI, caution is recommended when entering new long positions, as a market cooling period is forthcoming.
Trend Analysis Across Time Frames
In summary of the trend analysis observed:
- 1-week timeframe shows a strong bullish trend, with the price consistently making higher highs.
- 1-day timeframe indicates strength but is beginning to show signs of potential reversal with overbought conditions.
- 4-hour timeframe displays robust bullish sentiment but hints at the need for consolidation before further movement.
Potential entry points, based on the 1-hour timeframe analysis and the application of the indicators discussed, are as follows:
- Buy Entry Point: 3150, Take Profit Point: 3180, Stop Loss Point: 3135.
- Sell Entry Point: 3120, Take Profit Point: 3100, Stop Loss Point: 3130.
Given the current conditions that suggest strong bullish sentiment, a Buy scenario appears more likely, although traders should remain alert for signs of potential market corrections.