Sideways Market Unfolding: A Comprehensive Analysis on the USD/CHF Forex Pair – 01/04/2025
Tháng 3 31, 2025Gold vs US Dollar – An Upward Momentum with Potential Resistance at 3140 Ounce – 01/04/2025
Tháng 3 31, 2025
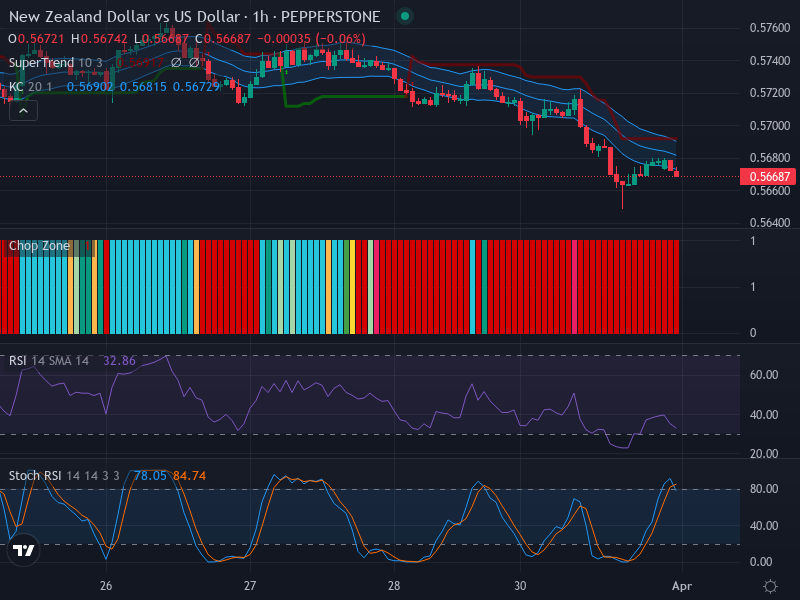
Market Overview: The NZD/USD (New Zealand Dollar vs US Dollar) pair demonstrates a more pronounced bearish bias due to an amalgamation of signals from candlestick formations and key technical indicators. An analysis of the lower price levels compared to the middle band of Keltner Channels, alongside the dominance of bearish candlestick formations, evinces the persistent downward trend. ## Technical Analysis: The downward bias is unequivocally exhibited in the candlestick patterns on the Forex chart. Traders, thus, are focusing more on short-selling strategies due to recurrent bearish candlestick formations. The price currently trades below the middle band of the Keltner Channels; this is a strong indicator that the bearish trend is far from over. The NZD/USD exchange rate is hovering around the 0.5660 mark, forming a potential zone of support. This could bolster a momentary price retracement, but short-term traders should be prepared for possible price fluctuation around this zone. Deep diving into the Relative Strength Index (RSI), the market edges close to oversold conditions, with an RSI value of 32.86. During such profound negative price movement, the absence of divergence in the RSI trend provides confluence, supporting the prevailing bearish bias. Further confirming the downward momentum, the Stochastic RSI tells a similar story. With K and D lines standing above 80, the Stoch RSI reveals an overbought market scenario. However, an intriguing observation is the recent crossover: the K line takes a downwards shift beneath the D line, hinting at a potential continuation of negative market sentiment. As we zoom out to the broader timeframes, the weekly trend for NZD/USD is incontrovertibly bearish. This is buttressed by the price stability below key moving averages. Similarly, the daily trend perpetuates this momentum, with the price consistently trading below the Keltner Channel. The 4-hour trend also corroborates this barrage of sell signals, demonstrating an increasing bearish sentiment. ## Conclusion and Trading Recommendations: With a confluence of diverse technical indicators pointing towards a sustained bearish momentum, traders should consider being predominantly short for NZD/USD, especially around the potential support zone of 0.5660. The buy entry point should ideally be at 0.5665, setting the take profit at 0.570. Nevertheless, monitoring the behaviour of the pair around the support zone is crucial, given the dynamic nature of forex markets. Trend Analysis: Looking at the trends across different time frames reveals a consistent bearish sentiment. For the 1-week timeframe, the trend remains unequivocally bearish. The 1-day analysis also shows continuous bearish pressure, further underscoring sell signals. The 4-hour timeframe reinforces this narrative with increasing negativity. – For the 1-week timeframe, it’s steadfastly downwards. – The 1-day analysis indicates sustained downward movement. – The 4-hour timeframe echoes this sentiment, marking a clear sell trend. Analyzing these indicators leads to potential entry points in the 1-hour timeframe, centering around the 0.5660 support zone. The current analysis suggests the following: – Buy Entry Point: 0.5665, Take Profit Point: 0.570, Stop Loss Point: 0.5650. – Sell Entry Point: 0.5650, Take Profit Point: 0.560, Stop Loss Point: 0.5670. Given the continuation of bearish signals across multiple indicators and timeframes, a Sell scenario appears more likely. Risk Disclaimer: The information contained in this research article is not investment advice. Trading forex involves substantial risk and may lead to losses. Each trader must carefully consider their financial position, risk tolerance, and trading strategy before making any trading decision. Any reliance you place on such information is strictly at your own risk.