USD/JPY Technical Analysis: Unveiling Potential Bullish Reversal Amid Stochastic RSI’s Overbought Signals – 01/04/2025
Tháng 3 31, 2025
Sideways Market Unfolding: A Comprehensive Analysis on the USD/CHF Forex Pair – 01/04/2025
Tháng 3 31, 2025Market Overview
With a considerable level of volatility in the foreign exchange market, the British Pound vs. US Dollar currency pair does not remain insensitive to these developments. Expanding on the technical analysis provided, the GBP/USD is currently showing a rather neutral trend, characterized by a horizontal or lateral price movement. This scenario warns forex traders to tread carefully, anticipating a probable bullish or bearish breakout.
Technical Analysis
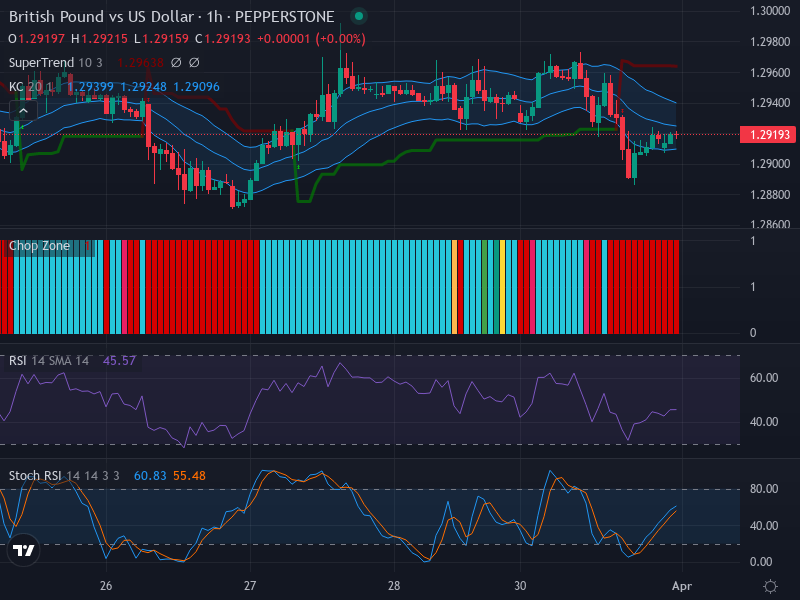
A careful study of the candlestick patterns on the hourly chart reveals an absence of any solid bullish or bearish indicators. This strengthens the lateral market direction narrative as prices fluctuate within the Keltner Channels, implying neutrality in the market conditions. Contrarily, a dearth of powerful price surges or retracements suggests a potential standstill in the market trend.
Turning to momentum indicators, the Relative Strength Index (RSI) stands at 45.57; this evaluation neither favors bears nor bulls. It consolidates the hypothesis of a sideway trading range mirroring the current price trend.
On the Stochastic RSI front, the readings are somewhat moderate with K at 60.83 and D at 55.48. The absence of any noticeable crossovers further strengthens the enduring trend — neutrality, corroborating the primary RSI findings.
Continuing with the Keltner Channels and Chop Zone analysis, our study shows that the price trend resides within the middle bands of the Keltner Channels, suggesting an insufficient long-term price trend. The Chop Zone’s red and light blue bars further endorse the concept of neutrality and side movement, signaling no immediate breakouts as prices have not closed beyond the Keltner Channels.
Conclusion and Trading Recommendations
Based on a meticulous analysis of the technical indicators, it can be summarized that the GBP/USD currently exhibits a lateral trend with a slight bearish bias on a 1-week trend. However, it maintains neutrality in a 1-day trend, adhering to a narrow trading range, and a similar scenario witnesses in a 4-hour trend. In light of this, traders are suggested to adopt a wait and see approach, observing the market carefully for potential breakout signals.
Analysis of Time Frames
- 1-Week Trend: Slight bearish bias, indicating potential selling pressure.
- 1-Day Trend: Neutral, reinforcing the need for caution.
- 4-Hour Trend: Similar neutrality, further supporting the observation of sideway movements.
Potential Entry Points
In light of the technical analysis, the following entry points can be considered:
- For a Buy scenario: Entry at 1.2300, Take Profit at 1.2400, Stop Loss at 1.2250.
- For a Sell scenario: Entry at 1.2200, Take Profit at 1.2100, Stop Loss at 1.2250.
After integrating the analysis of the different indicators and insights drawn from various time frames, it seems more likely that a Buy scenario may emerge given the modest bullish potential reflected in the slight bearish bias on a 1-week trend. However, close attention should be paid to changing indicators that may signal a potential reversal.