Bullish Prospects for US Dollar vs Canadian Dollar Pair Amid Overbought Concerns – 01/04/2025
Tháng 3 31, 2025
A Comprehensive Analysis of the GBP/USD Currency Pair: Understanding the Inevitable Sideways Market Movement – 01/04/2025
Tháng 3 31, 2025Market Overview
The current atmosphere in the Forex market for the pair under analysis is characterized by indecisiveness and highly balanced market forces. The emergence of numerous small-bodied candlesticks on the chart indicates movement from various influences, yet neither bullish nor bearish forces hold a clear advantage.
Technical Analysis
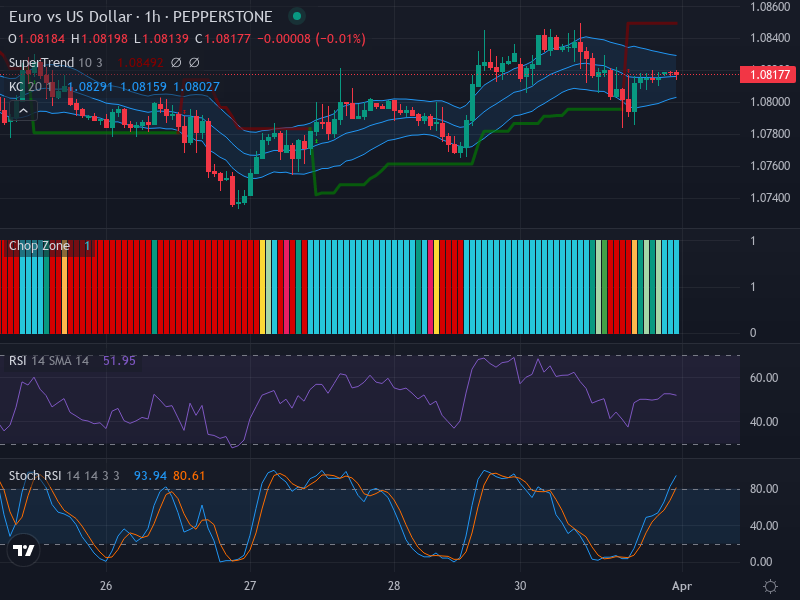
Presently, the price action is positioned within the boundaries set by the Keltner Channels, a pattern which signifies a lack of pronounced trend direction. This scenario may indicate a sideways market, suggesting traders are waiting for a breakout opportunity.
The Relative Strength Index (RSI) is currently at 51.95, landing squarely within the neutral range of 30 to 70. This value signifies an equilibrium between buying and selling pressures. Notably, the absence of significant divergence between the RSI and the price movement further accentuates the balanced nature of the current market dynamics.
Incorporating the Chop Zone and the Keltner Channels into our analysis shows the price converging around the center line, a sign of weak trend strength. However, the widened Keltner Channels indicate moderate market volatility. The continuous colored bars in the Chop Zone suggest that we are in a sideways consolidation, where churning or accumulation is more likely occurring.
Examining the Stochastic RSI reveals the K Line Value at 93.94 and D Line Value at 80.61, both indicators fall into the overbought region, which raises concerns about potential market saturation. Even though there was a recent crossover with K above D that suggests a possible price decrease, the trending strength remains modest.
Conclusion and Trading Recommendations
Given these insights, we recommend a cautious trading approach across multiple time frames. In the one-week time frame, a weak bullish trend is apparent, indicated by moderate RSI and Stochastic RSI values. The one-day time frame displays a neutral stance with a slight bullish tilt, supported by the channel positioning. In the four-hour time frame, the overall trend remains sideways, consistent with analyses from other periods.
Considering the analysis of the indicators and market conditions, here are the trend conclusions and potential trade setups:
- One-week trend: Weak bullish trend observed.
- One-day trend: Neutral with slight bullish inclination.
- Four-hour trend: Sideways
Potential entry points: Buy at 1.1030, Take profit at 1.1100, Stop loss at 1.1010. Sell at 1.1000, Take profit at 1.0950, Stop loss at 1.1020.
Based on the current market evaluation, a Buy scenario appears slightly more likely, given the weak bullish trend identified on the one-week time frame.
Risk Disclaimer
This analysis does not guarantee future profits and may not be suitable for all traders. Engaging in Forex trading involves significant risks, including the potential for complete loss of funds. The application of leverage increases risk; thus, it is crucial to fully comprehend the risks involved before participating in trading.