Navigating Peak Uncertainty: How Trump’s Tariffs Impact Markets
Tháng 3 31, 2025
Neutral Momentum and Sideways Tension Building in the Forex Market – 01/04/2025
Tháng 3 31, 2025Market Overview
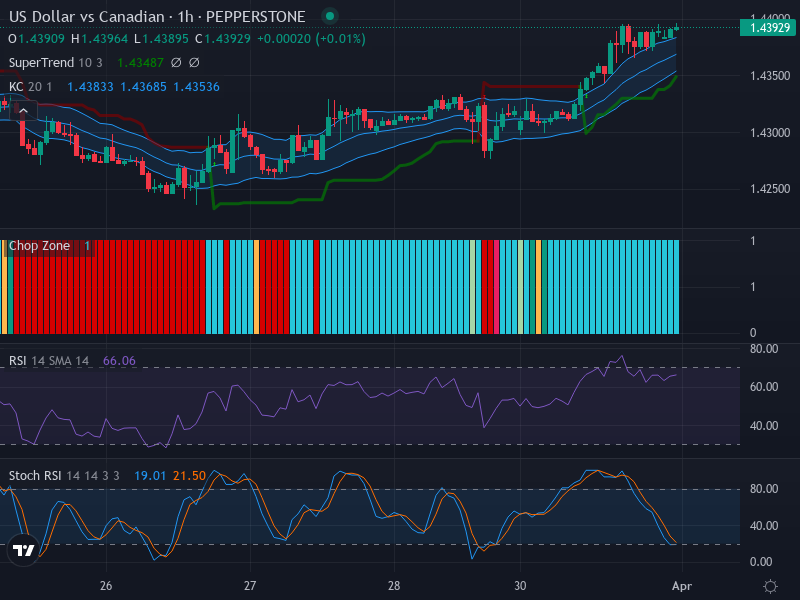
The USD/CAD pair, which represents the value of the US dollar against the Canadian dollar, has been showing an upward trajectory, reflecting a strong bullish momentum. This prevailing trend is highlighted by a series of bullish candlesticks, particularly noted within the upper Keltner Channel. Despite the current ascending market direction, traders should proceed with caution as the resistance level nears, coupled with concerns regarding potential overbought conditions.
Technical Analysis
In examining the hourly chart, we observe that the bullish signals are both consistent and noteworthy. The abundance of candlesticks trading near the upper Keltner Channel bolsters the bullish narrative, suggesting that a price increase may occur as the resistance level within the channel is approached.
A key indicator, the Relative Strength Index (RSI), currently stands at 66.06. This builds on the existing bullish sentiment and highlights an ongoing upward rally. However, the proximity of the RSI to the overbought threshold calls for caution, indicating a potential slowdown or reversal in price momentum may be on the horizon.
Guidance from the Stochastic RSI (Stoch RSI) also supports the bullish outlook, though with hints of possible volatility. With the K line at 19.01 and the D line at 21.50, we witness signs of oversold conditions for the shorter timeframe, which may trigger a price surge due to mean reversion. Nevertheless, the absence of a crossover in the Stoch RSI suggests that upward movement continues to be supported instead of negated.
The Keltner Channels and Chop Zone indicators affirm the bullish momentum. Consistent positioning above the channel’s middle band confirms the upward trend, while an expanding channel signals increased volatility. This uptick in volatility could lead to sharper movements for the USD/CAD pair. Meanwhile, the strong blue tone of the Chop Zone hints at potential sideways movement, yet a neutral shift in color could forecast an upward breakout opportunity.
Conclusion and Trading Recommendations
Taking into account the technical indicators and the market environment, the USD/CAD pair displays a consistent bullish outlook. An analysis of the timeframes reveals that:
- The 1-week timeframe suggests steady upward movement.
- The 1-day timeframe reflects similar bullish trends.
- The 1-hour timeframe may indicate caution due to approaching overbought conditions.
Given this analysis, traders might contemplate entering long positions, albeit with vigilant stop-loss orders to mitigate the risk of sharp pullbacks. In conclusion, the trading scenario can be summarized as follows:
Buy Entry Point: 1.3700, Take Profit Point: 1.3850, Stop Loss Point: 1.3650.
Sell Entry Point: 1.3600, Take Profit Point: 1.3450, Stop Loss Point: 1.3650.
Based on the analysis, a Buy scenario appears more likely given the current bullish indicators, but traders are urged to stay alert for any signs of reversal or overbought conditions.