
Euro’s Future: Major Institutions Project Strong Surge Against the U.S. Dollar
Tháng 4 30, 2025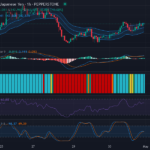
USD/JPY Marches Sideways: Intermittent Bullish Signals Require Scrutiny – 01/05/2025
Tháng 4 30, 2025Market Overview:
As we delve into the intricate analysis of the unnamed Forex chart, what is clear from the outset is the strong bearish momentum that currently envelops the market. The ongoing financial activity has seen the currency pair follow a significant downward trend. Observations from the price action and a set of technical indicators employed lend credibility to this assertion.
Technical Analysis:
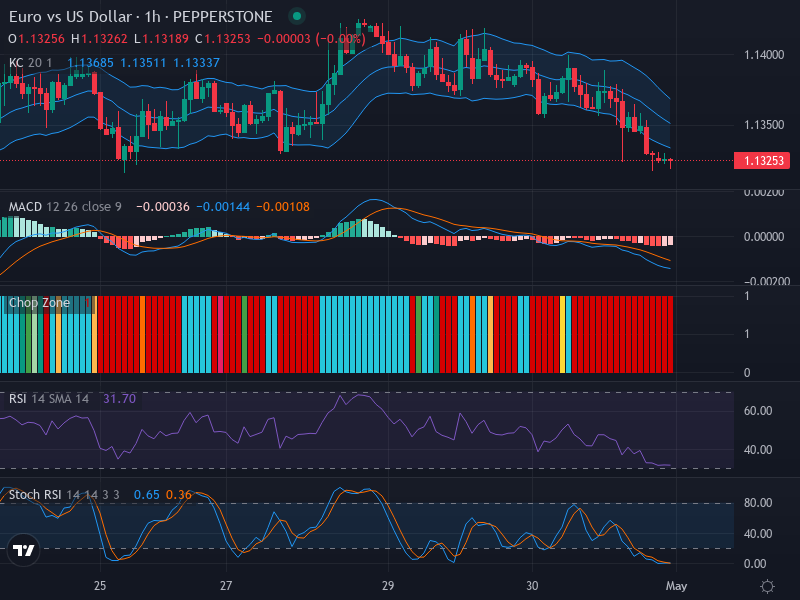
The candlestick pattern serves as the first indicator of the prevailing downward trend. Recent trading sessions have revealed the market’s strong bearish tendency, with sellers showing dominance and higher selling pressure. Our radar has also highlighted the critical areas of interest to watch, specifically the lower band of the Keltner Channel which could offer potential support.
On analyzing the Relative Strength Index (RSI), we see an affirmation of our initial observations. With a value of 31.7, the movement is heading toward the oversold region, affirming the sustained bearish momentum.
Adding another layer to our analysis, the Stochastic RSI (K=0.65, D=0.36) presents an interesting scenario. An intersection with K above D generally signals a potential price reversal. This inclination towards a short-term reversal is significant, albeit the overall picture still showcases dominance by bearish momentum.
To further cement the bearish sentiment, we look to the Moving Average Convergence Divergence (MACD). The slight positioning of the MACD line below the signal line screams bearish momentum. This, combined with the decline of histogram bars, assures the weakening momentum and demands caution for potential reversals.
Conclusion and Trading Recommendations:
The storyline for the past week has been the prevalence of a strong bearish trend. This sentiment is widely supported by various technical indicators, from the candlestick pattern and RSI to the Stochastic RSI and MACD, each validating and aligning with each other.
However, traders should proceed with caution. Potential short-term reversals might take place as implied by the Stochastic RSI. Vigilance is key to monitor further shifts in the trend.
Trend Analysis:
- In the 1-week time frame, indications suggest continued bearish pressure with sustained downward movement likely.
- The 1-day time frame shows signs of potential reversal, particularly around pivotal support levels.
- The 4-hour time frame confirms retracement opportunities amidst predominant bearish conditions.
Potential Entry Points:
Based on the analysis, traders should consider the following potential entry points and stop-loss levels.
- Buy Entry Point: 1.1200, Take Profit Point: 1.1250, Stop Loss Point: 1.1180.
- Sell Entry Point: 1.1150, Take Profit Point: 1.1100, Stop Loss Point: 1.1165.
In conclusion, the ongoing bearish scenario is likely to prevail, although traders should remain aware of short-term reversal signals as indicated by the Stochastic RSI. A Sell scenario appears more probable given the current analysis.


