Lateral Market Movement Continues in AUD/USD: Is a Trend Breakout Imminent? – 31/03/2025
Tháng 3 31, 2025
Klarna’s IPO on the Horizon: A Fintech Revolution Unfolds
Tháng 3 31, 2025Market Overview
In the contemporary Forex market, the New Zealand Dollar (NZD) and the US Dollar (USD) currency pair exhibits a significantly lateral movement sprinkled with slight upward attempts. As suggested by various technical indicators, the market idles in a state of neutrality with minimal volatility, awaiting a robust trigger to break out on either side.
Technical Analysis
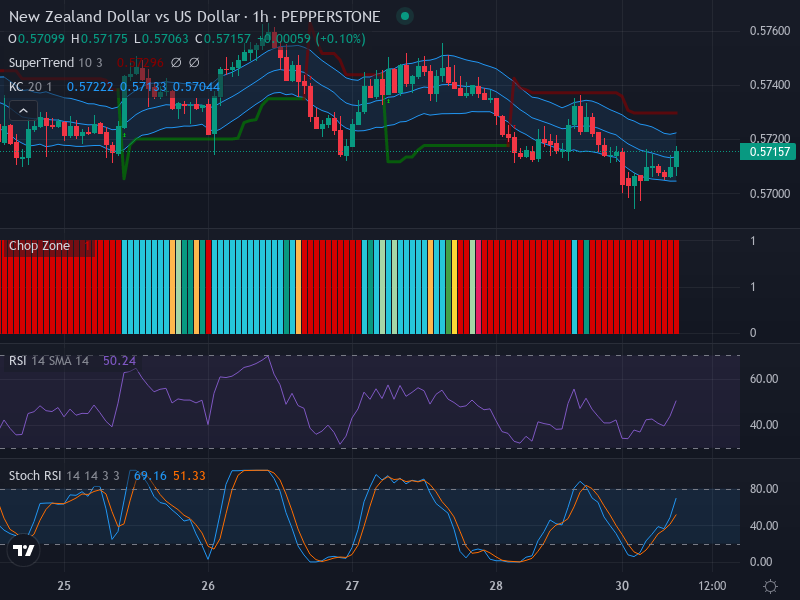
Our candlestick pattern analysis reveals the contemplative mood of traders, visible through the mild upward bias and an attempt to break above the middle band of the Keltner Channel. The prevalent market direction adds further clarity, as it continues to trend laterally, indicating a phase of consolidation or uncertainty.
Two significant zones worth watching include a potential resistance near 0.57220, highlighted by the market’s consistent inability to sustain above this level, and a support base around 0.57000. Breaking past these zones could spur consequential market moves.
The Relative Strength Index (RSI) complements this narrative with a value of 50.24, embodying a neutral market position. Absence of noticeable RSI divergence and adherence to lateral price movement indicates limited upward or downward momentum, thereby underscoring the ongoing market indecisiveness.
A transient glimmer of bullishness, however, surfaces when analyzing the Stochastic RSI. Here, the K line holds its position slightly above the D line, signaling a mild bullish crossover. However, the tepid conviction dampens the bullish enthusiasm to a certain extent.
The Keltner Channels and Chop Zone echo this market sentiment. With the price wafting near the middle EMA band, the trend-deficient market gives off hints of ambiguity. Furthermore, the limited channel width illustrates restrained volatility, in line with the existing sideways movement. A dominance of red bars in the Chop Zone accentuates this sideways market phase, characterized by amplified noise rather than clear price trends.
Conclusion and Trading Recommendations
Synthesizing these insights, while the market manifests a primarily neutral position, it harbors a slightly upward momentum, as suggested by the candlestick pattern and the mild bullish crossover in Stochastic RSI. Hence, traders should remain observant of these mixed indicators and tread cautiously near the identified support and resistance zones.
Trend Analysis
The following trends have been observed based on various time frames:
In the 1-week time frame, the trend shows mild bullish behavior with narrow price consolidation indicating cautious upward movement.
In the 1-day time frame, the market reflects a neutral stance with price oscillations around the significant levels of support and resistance, suggesting anticipation.
In the 4-hour time frame, we continue to see minor upward attempts amidst an overall sideways motion, capturing traders’ indecisiveness.
Based on these indicators, potential entry points at the 1-hour time frame are as follows:
Buy Entry Point: 0.57230, Take Profit Point: 0.57600, Stop Loss Point: 0.57000.
Sell Entry Point: 0.57000, Take Profit Point: 0.56650, Stop Loss Point: 0.57220.
Considering the slight bullish indicators coupled with the stubborn resistance level, a Buy scenario appears more likely to occur in this context.