Neutral Market Conditions Persisting for USD/CAD: A Forex Market Analysis – 31/03/2025
Tháng 3 31, 2025
A Comprehensive Study of the New Zealand Dollar vs US Dollar Pair: A Mildly Bullish Yet Neutral Outlook – 31/03/2025
Tháng 3 31, 2025Market Overview
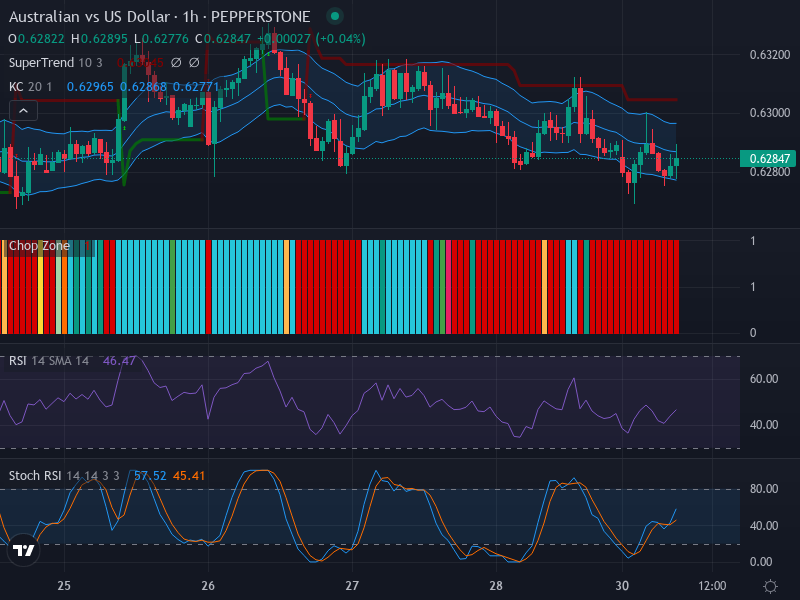
The current landscape of the Forex market, particularly for the AUD/USD pair, may appear ambiguous to some. Over the past few hours, the market has been exhibiting a mix of small-bodied candles with occasional longer wicks, alluding towards periods of indecision and interludes of volatility. This indecisiveness can be attributed to a generally flat market direction, indicative of a predominantly lateral or sideways trend.
Technical Analysis
The candlesticks have been hovering around the 0.6280 price level, marking it as a key potential pivot point in the current market state that could function as either support or resistance, depending on the market direction.
Deep diving into the various technical indicators, the Relative Strength Index (RSI), a leading indicator of market momentum, registers a value of 46.47. This places the market squarely in the neutral zone; neither demonstrating overbought nor oversold conditions. This echoes the sentiment of an ongoing lateral market movement due to the lack of significant divergence that signals a strong trend.
Nevertheless, the Stochastic RSI (Stoch RSI), another technical indicator that helps determine whether an asset’s price is in an overbought or oversold condition, offers a slight twist in the tale. Currently, the K line (57.52) ascends the D line (45.41) which traditionally signals a bullish momentum. But this signal is not highly defining since both these lines are hovering in the middle range and suggest only a mild bullish bias.
Further, looking at Keltner Channels and Chop Zone, the price has had a considerable movement around the middle Keltner Channel, insisting on the fact that the pair remains in a range-bound state.
Conclusion and Trading Recommendations
Given the current analysis, the AUD/USD market appears to be stuck in lateral movement with a mild bullish bias suggested by the Stoch RSI. There seems to be a standoff in market sentiment, with neither buyers nor sellers having the upper hand. Traders should remain vigilant and wait for a stronger signal before taking a decisive trading position.
In analyzing the different time frames, the following trends are observed:
- 1-Week Time Frame: The price is showing a consolidation phase with no clear breakout direction. The lack of momentum implies continued ranging may persist.
- 1-Day Time Frame: The market is also exhibiting sideways movement with relatively low volatility, suggesting that traders should be cautious about short-term trades that might not yield significant returns.
- 4-Hour Time Frame: There are brief spikes in buying activity, hinting at potential short-term bullish opportunities, but overall the context remains lateral.
Considering these indicators,
- Buy Entry Point: 0.6290, Take Profit Point: 0.6320, Stop Loss Point: 0.6260
- Sell Entry Point: 0.6270, Take Profit Point: 0.6240, Stop Loss Point: 0.6285
Overall, the analysis suggests that a Buy scenario may be slightly more probable if the price comfortably breaches the 0.6290 level, due to the mild bullish indication from the Stoch RSI. However, a solid confirmation is needed to validate this potential breakout, and caution is advised given the current market conditions.
Risk Disclaimer
It is important to keep in mind that past performance does not guarantee future results. Investing in Forex involves a great deal of risk, including the loss of all or a portion of your investment, as well as emotional distress. All risks, losses, and costs associated with investing, including total loss of principal, are your responsibility.