Bearish Trend Interspersed with Potential Retracements: An In-depth Examination of USD/CHF – 31/03/2025
Tháng 3 31, 2025
Lateral Market Movement Continues in AUD/USD: Is a Trend Breakout Imminent? – 31/03/2025
Tháng 3 31, 2025Market Overview
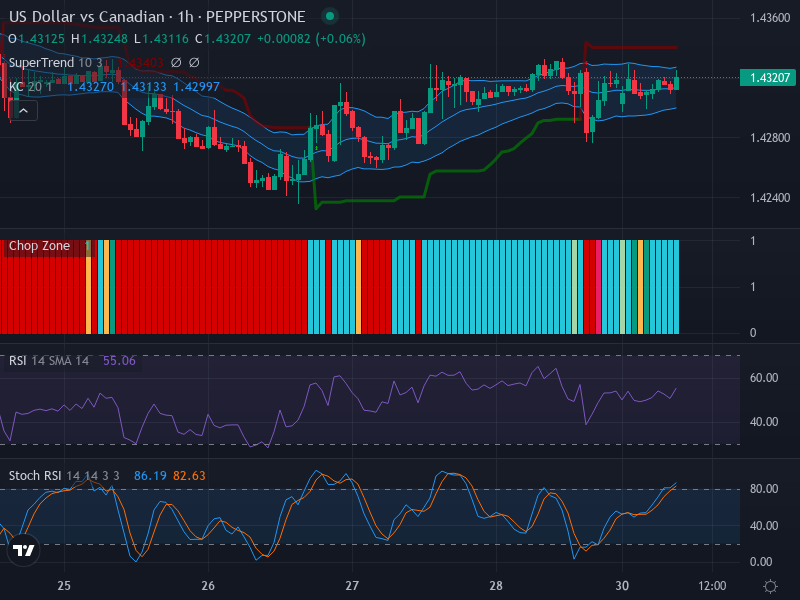
Peering into the Forex market, the USD/CAD currency pair has been simmering in its neutral state lately—translating into an ongoing sideways trend. The market’s tranquility is evidenced by small candlesticks on the chart. With no clear indications such as bullish engulfing or hammer patterns, the pair’s behavior has shown no sign of a sudden trend breakout or reversal.
Technical Analysis
Delving beneath the surface, we find this trendless environment echoed throughout the technical indicators. The Relative Strength Index (RSI), hanging moderately at 55.06, indicates neither overbought nor oversold conditions. This keeps the USD/CAD pair lodged in a neutral market position—consistently aligning with the overall picture of the current lateral market trend.
Additionally, the Stochastic RSI—another key marker of trend shifts—paints an intriguing canvas here. Even though the market remains balanced, with the K line (86.19) standing above the D line (82.63), we see signs of potential overbought conditions. This crossover signals a plausible downward correction. Therefore, traders should brace for a possible dip if the consumer demand recedes.
Turning our gaze to the price oscillation patterns inside the Keltner Channel, they again affirm the ongoing sideways trajectory. Price levels wallow near the middle band of the EMA 20, underscoring the present lack of a dominant trend. With no significant expansions within the Keltner Channel, the low-volatility backdrop in the USD/CAD market persists.
Finally, the Chop Zone’s alternating colors—primarily landing on light blue—offers another nod to these nebulous market conditions.
Conclusion and Trading Recommendations
Considering the prevailing sideways movement and neutral indicators, caution must guide trading decisions concerning the USD/CAD pair. While the lack of concrete signals points toward maintaining a ‘wait and watch’ strategy, the potential downward swing signaled by the Stochastic RSI should not be neglected.
Therefore, traders are advised to remain vigilant for any downward shifts in the market before entering any long-term commitments— but until these occur, it’s recommended to sit on the sidelines. Short term trading could be a viable option with careful stop-loss strategies in place.
Trend Analysis by Time Frame
In summary, the analysis of the 1-week, 1-day, and 4-hour time frames presents a clear picture for traders:
- In the 1-week time frame, the market shows a consolidating pattern with no clear breakout signals, indicating strength in neutrality.
- In the 1-day time frame, similar patterns emerge as the price continues to hover around the mid-point of its historical range, reinforcing the non-trending scenario.
- The 4-hour time frame reveals indecision among traders, as reflected in small fluctuations and the lack of predictive price action.
Potential Entry Points
For short-term opportunities:
- Buy Entry Point: 1.3570; Take Profit Point: 1.3600; Stop Loss Point: 1.3550.
- Sell Entry Point: 1.3540; Take Profit Point: 1.3510; Stop Loss Point: 1.3565.
Given the current indicators, a Sell scenario appears more likely due to the signals of potential downward corrections anticipated from the Stochastic RSI analysis.