
Gold Versus USD: A Neutral Standoff with Subtle Bearish Undertones in the Forex Market – 30/04/2025
Tháng 4 29, 2025Navigating Japan’s Industrial Production Trends: Insights from March 2025
Tháng 4 29, 2025Market Overview
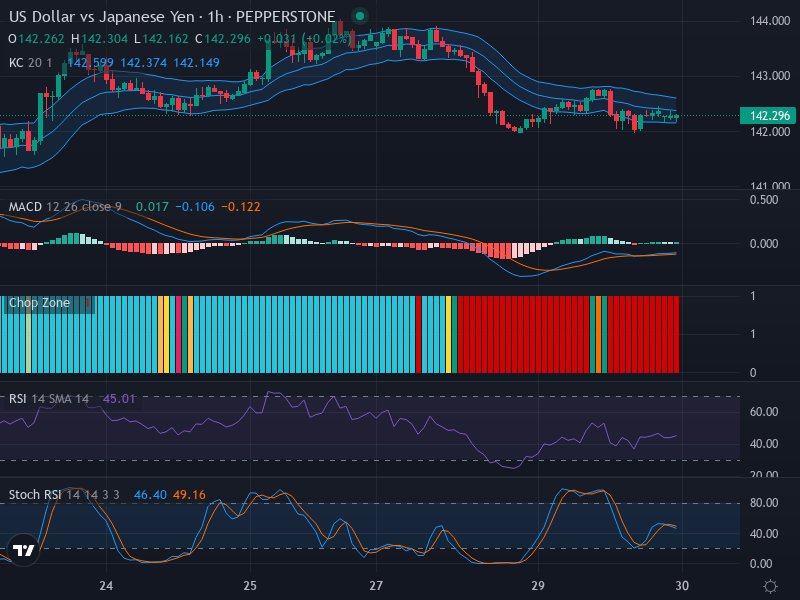
The forex market’s USD/JPY pair, currently priced at 142.296, exhibits a discernible trend of downward movement, punctuated by recent ambiguous fluctuations. The lately formed small-bodied candlestick patterns suggest a market indecision hanging ominously after a sequence of downward candles. This could be interpreted as the market taking a breather or possibly veering towards a reversal.
Technical Analysis
Upon closer inspection, candlestick formations provide significant insights into the currency pair’s behavior. Following consecutive red candles, the appearance of small-bodied candlestick patterns implies a sense of hesitation, which could indicate a delay or a shift in trend direction. Beware of a potential zone of volatility at 142.600; this represents an earlier support point now poised to become a retracement zone.
The Relative Strength Index (RSI), currently at 45, places the USD/JPY pair in the neutral zone, shielded from looming specters of overbought or oversold conditions. The RSI trend confirms the recent sideways price movement and intimates a staging area for consolidation.
Illuminating the current state of the market through Keltner Channels and the Chop Zone Indicators, the USD/JPY pair’s proximity to the middle band raises doubts regarding long-term directional momentum. The chop zone, painting a picture of sideways market conditions with its red bars, lends further strength to this interpretation. Traders should remain vigilant for potential breakouts. A scenario featuring the price closing 2 consecutive candles outside the Keltner Channel, coupled with a neutral Chop Zone, could hint at a fresh trend developing.
The Stochastic RSI amplifies these findings. With ‘K’ Line standing at 46.40 and ‘D’ Line at 49.16, the close alignment suggests a period of sideways movement. Coinciding with the supposition of neutral momentum, it fails to confirm any crossovers at this stage.
Conclusion and Trading Recommendations
The overall analysis of the USD/JPY pair concludes its phase of downward movement, dreaded by recent sideways shifts implying market indecision. Traders should eye the 142.600 level for a retracement possibility, paying extra attention to the neutrality echoed by the RSI, Keltner Channels, Chop Zone, and Stochastic RSI indicators.
Due to the noticeable lack of directional momentum, it is advised to refrain from aggressive trading maneuvers. Until a clear uptrend or downtrend is evident in the market, traders should remain on the sidelines and wait for stronger signals.
1-Week, 1-Day, and 4-Hour Trend Analysis
In the 1-week timeframe, the USD/JPY pair shows a mild bearish trend with range-bound trading patterns persisting. The 1-day analysis reveals a clear consolidation phase, suggesting indecision among traders on the market direction. On the 4-hour timeframe, the price oscillates within a tight range, primarily driven by short-term volatility and lack of momentum.
Based on this analysis, the signals indicate potential entry points at the 1-hour timeframe. Here’s how the trading setup looks:
- Buy Entry Point: 142.400, Take Profit Level: 142.600, Stop Loss Point: 142.200.
- Sell Entry Point: 142.200, Take Profit Level: 141.950, Stop Loss Point: 142.400.
Assessing the current situation, a Buy scenario appears more likely given the recent support levels, but traders should remain cautious and attentive to market developments.


