Elon Musk’s $2 Million Gamble: Legal Chaos in Wisconsin’s Supreme Court Election
Tháng 3 30, 2025
Navigating the Mixed Signals: An In-depth Analysis of the EUR/USD Currency Pair – 31/03/2025
Tháng 3 31, 2025Market Overview
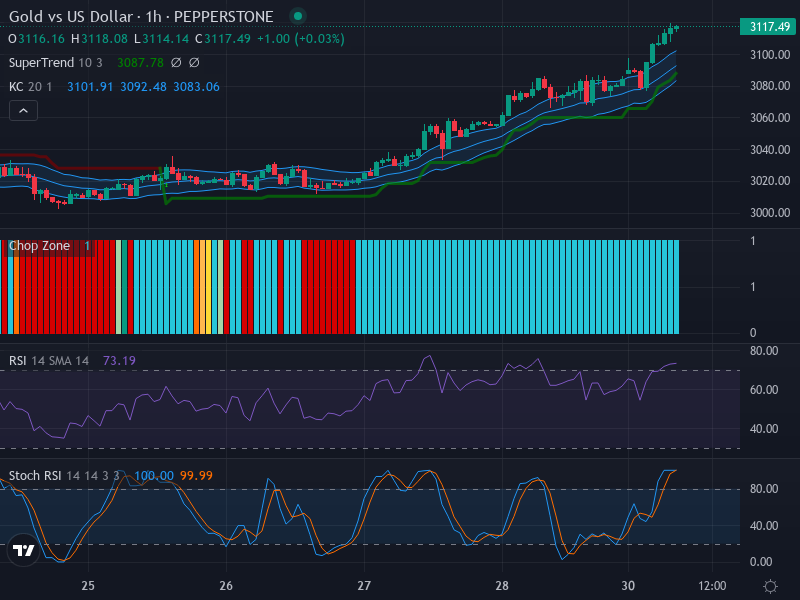
Over recent trading periods, the Gold vs US Dollar pair has exhibited a bullish pattern. The precious metal’s price is increasing relative to the Dollar, showcasing how investors continue to trust gold as a safe haven, especially amidst economic uncertainties. However, it’s crucial to assess the technical indicators to gain a more definite understanding of the market’s direction.
Technical Analysis
The review of the candlestick patterns shows an overwhelmingly bullish trend for the gold vs US Dollar trade. The bullish candles have been trading above the middle band of the Keltner Channels. This pattern increases confidence in the bullish momentum and projects potential further gains. However, keep an eye on the 3080 level, as this was a previous magnitude of consolidation, thereby possibly indicating a likely zone for retracements.
Diving into the momentum-based indicator, the Relative Strength Index (RSI) currently sits at 73.19. This value is notably above the typical ‘overbought’ threshold of 70, suggesting the market might be overheating – an indication of a potential pullback. Nonetheless, as there’s no notable divergence between price movements and the RSI values, the upward price trend remains valid within this overbought market.
Moreover, the Stochastic RSI (Stoch RSI) adds more depth to the analysis. The Stoch RSI has its K line value at 100 and the D line value at 99.99, clearly demonstrating a heavily overbought market condition, which parallels the regular RSI’s signal. Interestingly, the K line’s upward crossing over the D line confirms the bullish momentum, yet it similarly indicates caution, as potential reversals could be in the pipeline.
Conclusion and Trading Recommendations
Looking at these relevant metrics, the overall sentiment remains bullish for the week and day. The 4-hour trend also communicates a steady upward movement, thus pointing towards resilience in the bullish direction. However, the overbought status in both the RSI and Stoch RSI proposes a potential pullback and warrants caution.
In terms of trading strategy, here are the analyses based on different time frames:
The 1-week trend showcases continued bullish support, indicating a strong buyer presence. The 1-day perspective reflects immediate upward momentum suggesting active buying. The 4-hour chart reveals minor fluctuations, yet consistent higher highs support a bullish outlook.
Potential entry points based on this analysis include the following:
- Buy Entry Point: 3080, Take Profit Point: 3150, Stop Loss Point: 3040
- Sell Entry Point: 3070, Take Profit Point: 3000, Stop Loss Point: 3100
In conclusion, the analysis leans towards a Buy scenario being more likely, especially if the price behaves around the retracement level of 3080. However, traders should remain vigilant for any signs of reversal before entering into any sell positions. This nuanced approach ensures that decisions align with market dynamics and enhance trading effectiveness.