
Analyzing Potential Trends: USD/JPY in Near Oversold Condition with Bullish Crossover Possibility – 29/04/2025
Tháng 4 28, 2025Goldman Sachs Warns: US Tariffs Could Threaten 16 Million Jobs in China
Tháng 4 29, 2025EUR/USD Navigates Through Bullish Trajectory But Pullback Expected: A Comprehensive Forex Analysis
Market Overview
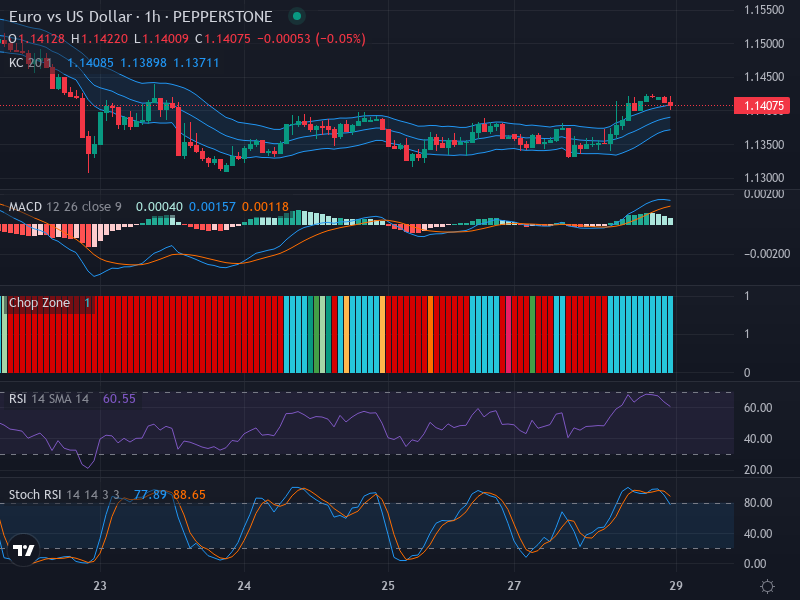
The EUR/USD Forex pair has been making steady strides, exhibiting a predominantly bullish trend in recent sessions. With the current price of 1.14075, the pair is teetering on the edge of potential resistance and likely to experience some turbulence before maintaining an uninterrupted upward movement.
Technical Analysis
On visualizing the EUR/USD Forex chart, recent candlestick activity intimates a possible bullish progression. Evidence from a previous bullish engulfing pattern demonstrates a potential for impending upward momentum. However, turbulence may be underway as the market approaches a resistance level around 1.14200, suggesting traders should observe the dynamics around this level with caution.
Meanwhile, the pair has potential support near the middle Keltner Channel band located approximately at 1.13800, which could serve as a safety cushion in case of a downward price correction from the resistance.
A subsidiary yet vital validation of the chiefly bullish sentiment comes from the Relative Strength Index (RSI), currently marking 60.55, suggesting the existing bullish trend is neither over-stretched nor losing momentum. However, approaching the overbought territory warrants due vigilance as momentum could pivot, signaling a possible reversal.
The Stochastic RSI analysis, with its ‘K’ Line at 77.89, and the ‘D’ Line at 88.65, presents a more nuanced picture. Although the pair seems to be in an overbought zone, the recent crossover observed does affirm the prospect of a price pullback. This supports the bullish narrative, albeit hinting towards a temporary caution due to the overbought status.
Adding another layer of complexity to the analysis is the Moving Average Convergence Divergence (MACD). The MACD, currently at 0.00040, trails behind the signal line pegged at 0.00118. Unfortunately, we have not observed any recent bullish crossover, and combined with a retreating histogram, it denotes a possible weakening of momentum and foreshadows an impending pullback.
Conclusion and Trading Recommendations
Taking into account the technical indicators, a cautiously optimistic stance may best serve the traders dealing with the EUR/USD pair. Our analysis suggests a potential bullish trend in the short term, weakened by the likelihood of a slight pullback due to resistance barriers and overbought status. Thus, traders are advised to carefully watch the zones near the identified resistance and support levels and plan trades accordingly.
Trend Analysis for Different Time Frames
- 1-Week Trend: The longer-term outlook remains bullish, but signs of consolidation are emerging, indicating traders should be prepared for fluctuations.
- 1-Day Trend: The daily charts reflect resilience in the upward trend, though resistance levels are imminent, suggesting caution in entering new positions.
- 4-Hour Trend: More volatility is observed in the 4-hour timeframe, with potential pullbacks on the horizon as momentum shows signs of weakening.
Entry Points and Profit Zones
- Buy Entry Point: 1.13900, Take Profit Point: 1.14450, Stop Loss Point: 1.13650.
- Sell Entry Point: 1.14200, Take Profit Point: 1.13550, Stop Loss Point: 1.14400.
Based on the described analysis, it appears that a Buy scenario is slightly more favorable. However, traders should remain vigilant and adapt their strategies based on real-time market movements. The forecast suggests a potentially lucrative trading opportunity with careful watching of the resistance and support levels.


