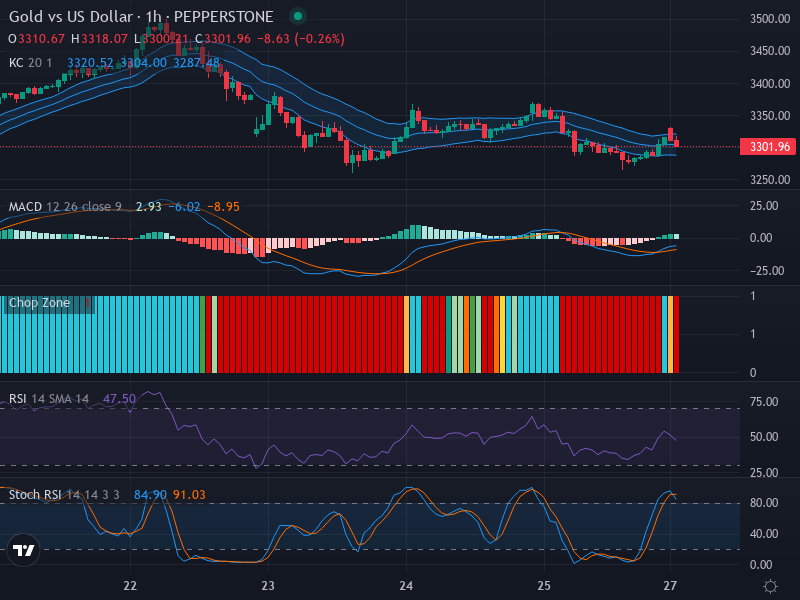
Gold vs US Dollar: An In-Depth Forex Analysis Awaits a Trend Decision – 28/04/2025
Tháng 4 27, 2025
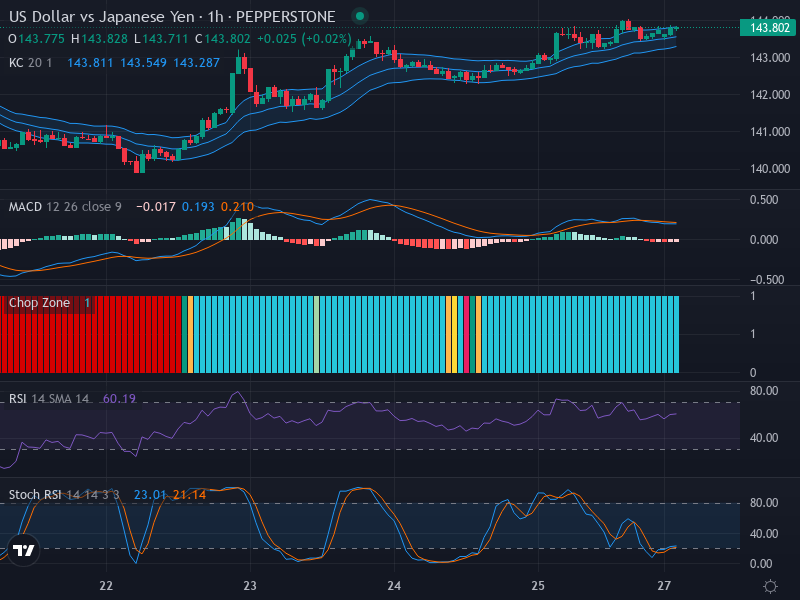
USD/JPY Exchange Rate – A Close Look at the Indicators – 28/04/2025
Tháng 4 27, 2025Market Overview
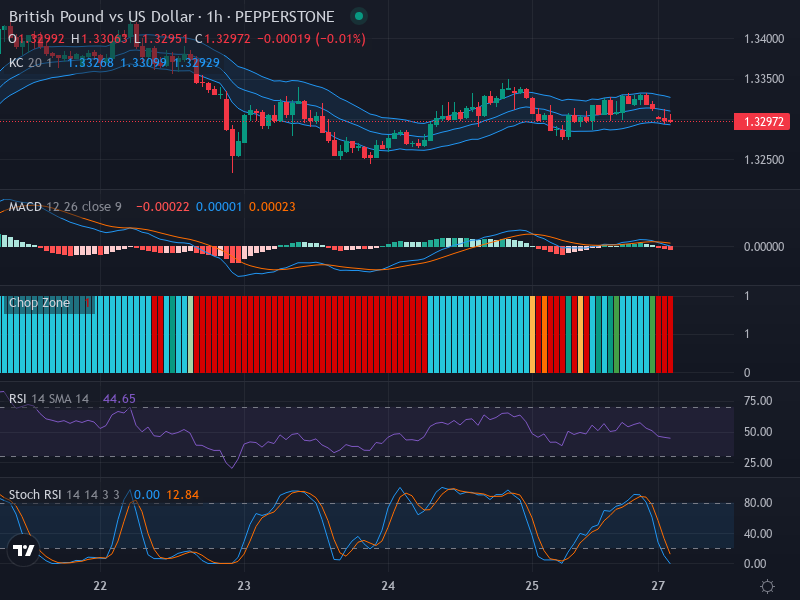
The prevalent forex market pair, British Pound vs. US Dollar (GBP/USD), has been experiencing a noteworthy trending hiatus as of recent. Currently trading at 1.32972, the pair’s movements feature a series of small-bodied candles indicating a dominant sense of uncertainty or a pause in trend direction. This reflects not just the absence of potential swings in the market, but also a slight downward bias, marking a tepid sentiment among traders towards this currency pair.
Technical Analysis
A pullback in the trading action on the chart highlights the possibility of a deadlock between the supply and demand forces. A conspicuous sideways trend is evident, with support and resistance levels closely watched around 1.32700 and 1.33300 points respectively.
The analysis of the Relative Strength Index (RSI) substantiates this view by confirming a near neutral yet slightly bearish market environment. The RSI value of 44.65, which is below the threshold of 50, suggests the appropriateness of trader anticipation for a potential bearish momentum. At the same time, the synchronicity between RSI and price action bolsters the tenet of continued sideways movement in the market.
The Keltner Channels provide another crucial insight into this scenario. With the price hovering close to the middle of these plotting bands, market consolidation becomes a prominent discussion. The channel’s moderate breadth designates a reasonable degree of volatility, keeping traders on their toes. Meanwhile, the Chop Zone notifies traders to maintain their cautious stance, with dominant red bars reaffirming the potential for a market stuck in a range.
Turning our attention to the Stochastic RSI, we fall upon an intriguing discovery. Both K and D lines maintain a presence in the oversold region, at values of 14.13 and 12.84 respectively. This alignment typically implies a potential move for an upward price correction, injecting a hint of bullish optimism in an otherwise bearish environment.
Finally, our MACD Analysis shows the MACD line near the 0 level, underlying the scarcity of convincing momentum to warrant a robust directional shift. Moreover, the fact that the MACD is shadowing beneath the signal line could suggest some bearish momentum in the near term.
Conclusion and Trading Recommendations
Given the comprehensive scrutiny of the relevant technical indicators, the GBP/USD pair seems to reflect a prevalent sense of uncertainty with a slight bearish tilt. Traders should closely monitor the support and resistance levels, while also considering the potential for an upward price correction indicated by the Stochastic RSI. As such, a prudent strategy would be to wait for more definitive confirmations like a breakout beyond the defined support and resistance zones before initiating any trading positions.
Trend Analysis Summary
In analyzing the trends across different time frames:
- 1-Week Trend: The GBP/USD has shown a sideways movement with minor bearish sentiment, indicating stability but no significant directional change.
- 1-Day Trend: Recent movements remain constrained between key levels, revealing hesitation among traders, with slight bearish undertones.
- 4-Hour Trend: The pair reflects a lack of clear momentum, trapped in a tight range with potential for short-term fluctuations.
Based on this analysis, potential trading scenarios could be envisioned at the 1-Hour time frame. A Buy entry point could be placed around 1.33100, with a Take profit point at 1.33500 and a Stop loss point at 1.32850. Conversely, a Sell entry point could be considered at 1.32800, with a Take profit point at 1.32500 and a Stop loss point at 1.32900.
Given the overall market positioning and indicators favoring a potential upward correction, the Buy scenario seems more likely to occur in the short term, contingent upon a break above current resistance.