
China’s Industrial Profits Rebound: Q1 2025 Shows Positive Growth Signals
Tháng 4 27, 2025
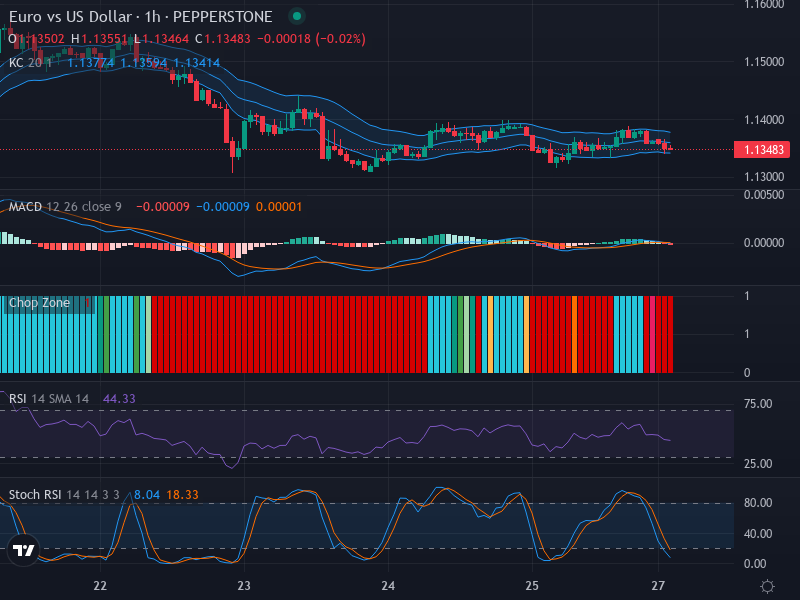
A Closer Look into the Subtle Bulls of the USD/CAD Market – 28/04/2025
Tháng 4 27, 2025In today’s Forex market, the importance of technical analysis cannot be overstated. As we analyze the charts and indicators, we can derive significant insights into currency pairs that could shape trading strategies. This blog will dive into the key indicators and trends that define the Forex landscape as of April 28, 2025.
Starting with trend analysis, it’s essential to understand that trends dictate the overall sentiment in the market. Currently, key currency pairs display mixed signals, suggesting cautious optimism. For example, the EUR/USD pair has seen an upward trend in recent weeks, bolstered by positive economic data from the Eurozone. In contrast, the GBP/USD seems to be consolidating after recent volatility, reflecting the uncertainties tied to current economic policies in the UK.
When we examine the Relative Strength Index (RSI), we find that many pairs are approaching overbought territory. A reading above 70 indicates that a currency may be overvalued, prompting traders to consider a potential correction. This is crucial as it helps identify entry and exit points for trades.
Next, let’s consider the moving averages. The crossover of the short-term moving averages above long-term moving averages indicates bullish momentum. This is visible in several currency pairs, creating opportunities to capitalize on potential upward movements. Traders should pay attention to these signals to make timely decisions.
The Bollinger Bands provide further insights, showing the volatility trends within currency pairs. When bands contract, they suggest that a breakout is imminent. Therefore, this is the perfect time to consider potential trading positions as currency pairs either break upward or downward.
In conclusion, synthesizing the analysis from three time frames reveals important trends. Over the past week, the overall trend remains positive, suggesting a bullish continuation in major pairs. Following is the breakdown of the trends:
- The 1-week time frame shows a strong bullish trend in several major currency pairs, driven by favorable economic indicators.
- The 1-day time frame indicates a potential correction in the market, suggesting limited upward movement.
- The 4-hour time frame demonstrates mixed signals, with some pairs consolidating while others continue their upward trend.
From this analysis, potential entry points emerge for the 1-hour time frame. Traders could consider the following specific entry points:
- Buy Entry Point: 1.0905, Take Profit: 1.0950, Stop Loss: 1.0880
- Sell Entry Point: 1.0915, Take Profit: 1.0880, Stop Loss: 1.0930
Based on the recent analysis, the likelihood of a Buy scenario is stronger due to overall market sentiment and technical indicators favoring upward movement. However, traders should remain vigilant and responsive to any fundamental news that could impact these trends.


