
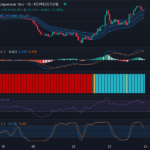
USD/JPY: Bullish Trajectory Confirmed but Exercise Caution, As Overbought Conditions Loom – 24/04/2025
Tháng 4 23, 2025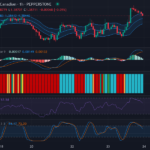
Bullish Momentum Identified in USD/CAD Pair Amid Short-Term Consolidation – 24/04/2025
Tháng 4 23, 2025Market Overview
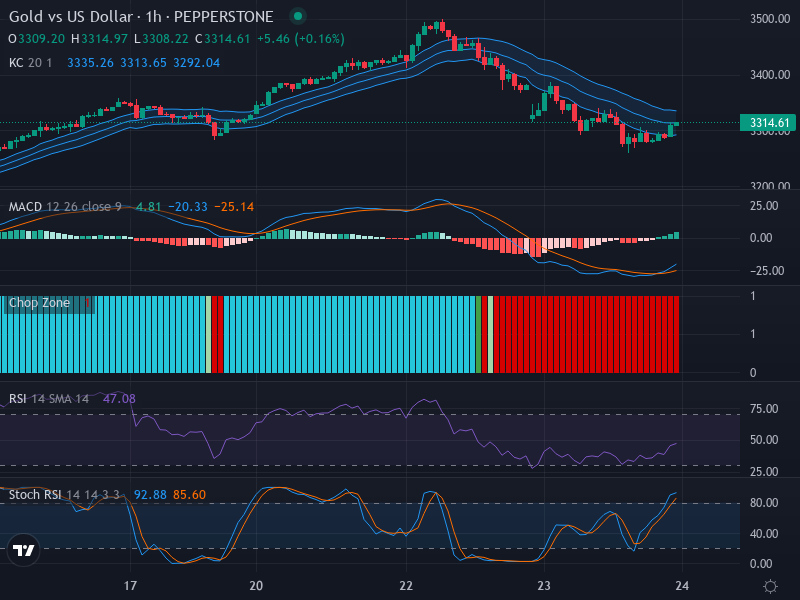
The current market scenario of Gold against the US Dollar is becoming increasingly intriguing. The recent activities suggest a possible stabilization after a period of a downward trend. With the current price standing at 3314.61, the Gold USD market seems to be moving sideways with hints at a mild uptrend. Although there are no strong bullish candlestick patterns, such as bullish engulfing or a hammer, a close examination of the chart patterns reveals the potential for a retreat near the 3350 mark.
Technical Analysis
An important variable to consider in this analysis is the Relative Strength Index (RSI). Presently, the RSI value stands at a neutral 47.08. This neutrality of the RSI is indicative of the fact that the market does not favor either a bearish or bullish trend emphatically, thus urging investors to proceed with caution when considering major directional trades. Furthermore, no outstanding divergence between the RSI values and the price movement is observed, adding another layer of uncertainty to the market trend.
The Stochastic RSI, another key technical indicator, provides a slightly different outlook. The current values register %K at 92.88 and %D at 85.60. Interestingly, the %K line is now crossing the %D line, which generally indicates the possibility of bullish momentum. This high value of Stochastic RSI seems to suggest the potential for short-term upward movement, despite the overall dominance of a lateral trend.
The Keltner Channels and Chop Zone are also revealing in this analysis. Right now, the price hovers just below the middle band of the Keltner Channels, which hints towards a transition from a neutral to a mild uptrend. The Chop Zone, showcasing red bars of moderate thickness, signifies either a sideways market or a slightly disruptive one. This suggests a lack of clear direction. As of now, no definitive potential breakout signal has been confirmed.
Conclusion and Trading Recommendations
Given the current market conditions and technical indicators, investors are advised to wait for clearer signals to emerge. The absence of strong bullish candlestick patterns, coupled with a neutral RSI, subtle hints of an uptrend from Stochastic RSI, and mixed signals from Keltner Channels and the Chop Zone create an ambiguous climate, affording no clear trading direction. Thus, a cautious approach is advised until the market indicates more definitive signals.
Trend Analysis
In conclusion, focusing on different time frames can provide further insights:
- 1-Week Time Frame: The trend shows signs of stabilization, indicating a potential bottoming pattern with minimal bullish activity.
- 1-Day Time Frame: The market appears to be flat with indecisiveness, supporting the lack of strong directional bias.
- 4-Hour Time Frame: A slight upward movement is on the horizon, but any significant momentum is yet to be established.
Potential Entry Points
Considering the aforementioned analyses, entry points are crucial for traders looking to capitalize on the current conditions:
- Buy Entry Point: 3320, Take Profit Point: 3350, Stop Loss Point: 3300.
- Sell Entry Point: 3300, Take Profit Point: 3270, Stop Loss Point: 3325.
In summary, a Buy scenario seems to be more probable due to the subtle bullish signals from the Stochastic RSI, but traders should exercise caution given the overall market uncertainty. The absence of strong signals warrants careful planning.


