
Forex Technical Analysis for April 24, 2025 – 24/04/2025
Tháng 4 23, 2025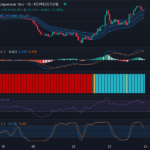
USD/JPY: Bullish Trajectory Confirmed but Exercise Caution, As Overbought Conditions Loom – 24/04/2025
Tháng 4 23, 2025Market Overview
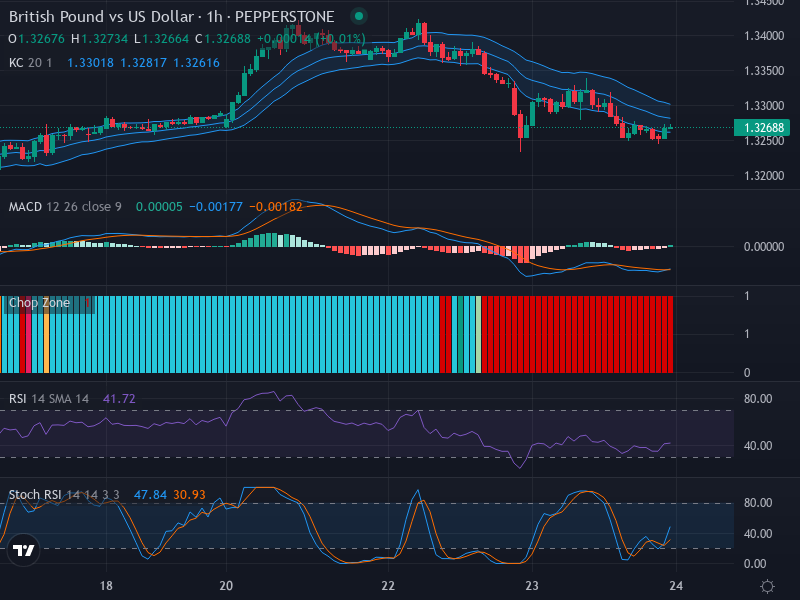
The British Pound (GBP) vs US Dollar (USD) currency pair has been exhibiting a strong downward trend. With the current trade price at 1.3268, the GBP/USD pair shows prevailing bearish movements reflected in the last series of candlesticks, creating a delicate balancing act with respect to the market indicators.
Technical Analysis
Taking a step inside the candlestick pattern of the GBP/USD chart, one cannot overlook the dominating downward trajectory following a brief uptrend. These bearish indicators strongly hint at a continuation of the downward trend. The immediate resistance level sits near 1.3300, indicating a solid barrier for upward movements. Conversely, a breach below the support level of 1.3250 could unleash a battery of selling pressure, fueling the bearish trend.
Simultaneously, the Relative Strength Index (RSI) sitting at 41.72 confirms the bearish narrative. Bordering the oversold territory indicates substantial selling movement in the market. While it supports the dominant bearish outlook, it also flags a potential for a brief rebound considering its proximity to oversold conditions.
Contrarily, the Stochastic RSI shows a short-term bullish divergence to consider. With the ‘K’ value at 47.84 being above the ‘D’ value of 30.93, this divergence could temporarily counteract the principal downward momentum.
Contrasting this is the Moving Average Convergence Divergence (MACD) analysis, which currently shows no clear crossover. With the MACD line at -0.00177 and the signal line at -0.00182, it implies weak momentum. The MACD histogram aligns with this perspective, showcasing only a slightly positive momentum, which does not signify a strong bullish move.
Conclusion and Trading Recommendations
Given the overwhelming bearish indicators, the GBP/USD pair seems poised to continue its downward voyage. However, market participants should remain vigilant, given the close proximity of RSI to the oversold territory and the slight bullish divergence on Stochastic RSI. Traders could potentially take a short approach, but caution is advised due to the possibility of intermittent rebounds.
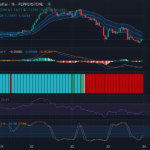
1-week Trend Analysis: The weekly chart indicates an ongoing significant downtrend, suggesting a persistent bearish outlook.
1-day Trend Analysis: The daily analysis shows that the price is consistently rejecting higher levels, confirming the strength of the current downtrend.
4-hour Trend Analysis: On the 4-hour chart, the bearish momentum remains strong, with lower highs and lower lows indicating further declines likely.
Considering the analysis presented above, potential trading entry points would be:
- Buy Entry Point: 1.3280, Take Profit Point: 1.3300, Stop Loss Point: 1.3260.
- Sell Entry Point: 1.3250, Take Profit Point: 1.3200, Stop Loss Point: 1.3260.
Based on the prevailing downward trends suggested by all time frames, a Sell scenario appears more likely to occur in the current market conditions.


