
Bearish Dominance Persists in GBP/USD Amidst High Volatility: A Comprehensive Forex Analysis – 23/04/2025
Tháng 4 22, 2025
EUR/USD Technical Analysis: A Dip Before the Bounce? – 23/04/2025
Tháng 4 22, 2025Market Overview
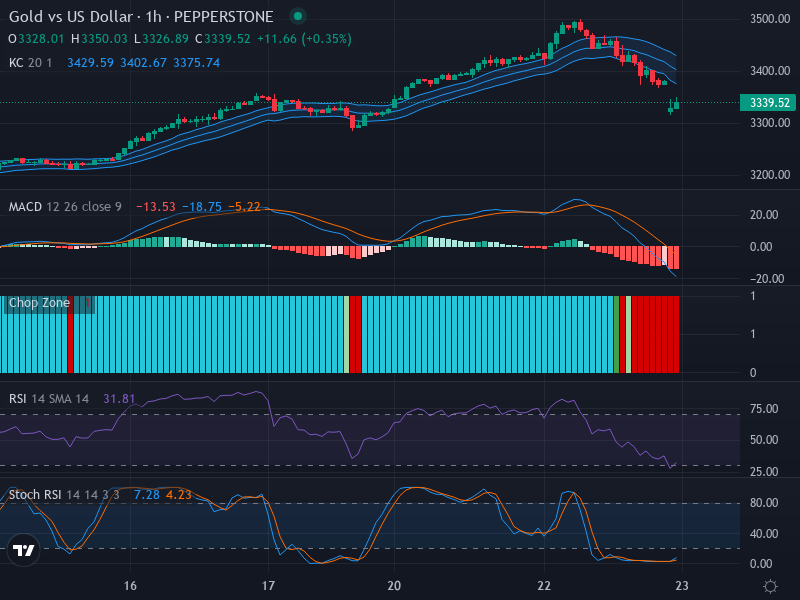
Recently, in the Forex market, the currency pair of Gold and US Dollar has come under the spotlight due to its sustaining downward trend. The current price of the pair is 3339.52 USD. The significant drops in recent periods suggest that this bearish trend might continue in the future. However, considering a host of technical indicators, there might be a case for potential upward correction or even a possible market turnaround.
Technical Analysis
An in-depth examination of the candlestick pattern reveals continued bearish pressure on Gold, following substantial dips in its value. However, the presence of small-bodied candles intimates a sense of market indecision, offering hopeful bulls a glimmer of potential reversal. Should the market tap into this potential, we might see a retracement up to the resistance level, estimated around 3400 USD.
The Relative Strength Index (RSI) lends support to reversal speculation, with a current value sitting at 31.81, indicating an oversold market scenario. In Forex trading, an oversold RSI often suggests an imminent upward movement. Additionally, a positive divergence could be on the horizon if the Gold’s value decreases while RSI experiences a rise, indicating a weakening bearish momentum.
Adding weight to upward correction sentiment is the Stochastic RSI scrutiny with both K and D values resting within oversold territory. A pending crossover in this area will strengthen the case for a reversal or at least an upward corrective phase.
Lastly, an analysis of the Moving Average Convergence Divergence (MACD) unveils a potential bullish momentum. The current MACD line is above the signal line, offering hints of buying pressure. Unfortunately, a declining histogram tempers the bullish prospect by indicating that bullish momentum might be slowing down.
Conclusion and Trading Recommendations
Considering all the technical indicators, it is essential for speculators to be cautious. While the current trend steers bearish, several indications suggest the possibility of an upward market correction. The downward momentum seems to be losing its strength, as shown by potential divergences, and the market commands are dwelling in oversold territories. Traders ought to look out for more supportive signals before setting their buying options.
After analyzing the 1-week, 1-day, and 4-hour time frames, here are the trends observed:
- The 1-week timeframe indicates a strong bearish trend but is showing signs of potential stabilization.
- In the 1-day timeframe, indications of oversold conditions could lead to a short-term reversal.
- The 4-hour timeframe suggests an imminent upward correction as buyers appear to gather momentum.
To capitalize on market movements, potential entry points based on the 1-hour timeframe are as follows:
- Buy Entry Point: 3345 USD, Take Profit Point: 3380 USD, Stop Loss Point: 3330 USD.
- Sell Entry Point: 3325 USD, Take Profit Point: 3300 USD, Stop Loss Point: 3340 USD.
Based on the comprehensive analysis of all indicators and time frames, it appears that a Buy scenario is more likely to occur, especially considering the support levels identified. Traders should remain vigilant and adjust their strategies as needed.


