
Bull Run on the Horizon for US Dollar vs Japanese Yen? A Comprehensive Forex Analysis – 23/04/2025
Tháng 4 22, 2025
Gold vs US Dollar: A Technical Analysis Report on Potential Market Reversal – 23/04/2025
Tháng 4 22, 2025Market Overview
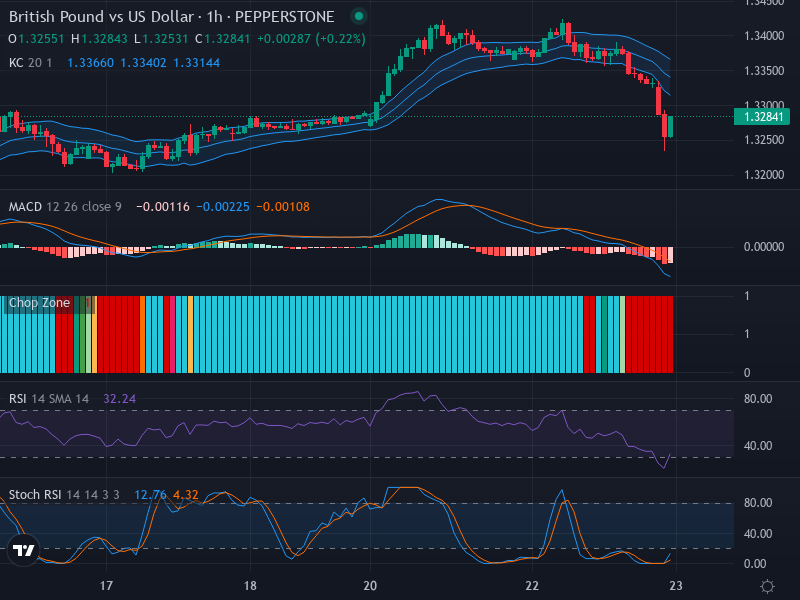
The British Pound (GBP) faces a discernible sell-off relative to the United States dollar (USD). Currently priced at 1.32841, the pair, better known as GBP/USD, is showing signs of extending its downward trend. Recent bearish momentum in the chart, coupled with high volatility indicators, sets a dynamic backdrop for currency traders.
Technical Analysis
A deep dive into the GBP/USD technical analysis reveals compelling insights. The latest candlestick formation paints a picture of strong bearish dominance. Highlighted by a significant bearish thrust, the currency pair may be on the precipice of further downward movement. The latter is further reinforced by the pair’s current situation below the Exponential Moving Average (EMA 20) middle band in the Keltner Channels—a convincing storage of bearish bias.
Looking closer at the potential zones, we observe that the pair’s possible trajectory towards the 1.3200 region, found at the lower edge of the Keltner Channel. Triggered by the current sell-off, this could mark the next critical support level for GBP/USD.
However, this bearish undertone should not overshadow the looming oversold conditions, hinted at by the indicators under scrutiny—the Relative Strength Index (RSI) and Stochastic RSI. Currently, the RSI is dwelling at 32.24, gravitating towards the oversold territory. This symbolizes that the bearish ride might see some breaks, potentially paving the way for price retracement or consolidation.
The outlook is echoed by the Stochastic RSI, a momentum oscillator. With the K and D lines treading at 12.76 and 4.32, respectively, within the oversold region and showing a recently formed bullish crossover, the scene is being set for a potential price consolidation or a short-term price correction.
Moreover, the Chop Zone’s red hue contributes to the narrative, indicating a possible spike in volatility amidst a predominantly sideways market phase.
Conclusion and Trading Recommendations
In summary, GBP/USD is nestled within a bearish trend, accentuated by considerable volatility. As such, traders should be aware of the heightened risk levels, which may yield high rewards or considerable losses, depending on the position taken. It is advisable to consider short positions in the currency pair, albeit with a keen eye on potential corrective moves due to the brewing oversold conditions.
Despite the predominantly bearish sentiment, market participants should also consider potential intraday buying opportunities following any retracement or consolidation guided by RSI and Stochastic RSI cues.
Trend Analysis
- 1-Week Time Frame: The trend is firmly bearish, indicating continued pressure below key resistance levels.
- 1-Day Time Frame: A strong bearish momentum persists, suggesting that the downward trend may continue.
- 4-Hour Time Frame: The potential for a short-term correction exists, especially with oversold indicators indicating a possible reversal.
From this analysis, potential entry points based on the 1-hour time frame are as follows:
- Buy Entry Point: 1.3250, Take Profit Point: 1.3285, Stop Loss Point: 1.3230.
- Sell Entry Point: 1.3280, Take Profit Point: 1.3200, Stop Loss Point: 1.3300.
Overall, given the current analysis, a Sell scenario seems more likely to occur, considering the prevailing bearish momentum and indicators suggesting further downside pressure.


