Compelling Opportunities Emerging in EUR/USD Amid Volatile Market – 22/04/2025
Tháng 4 21, 2025
GBP/USD: An Opportune Retracement Amid Dominant Upward Trend – 22/04/2025
Tháng 4 21, 2025Market Overview
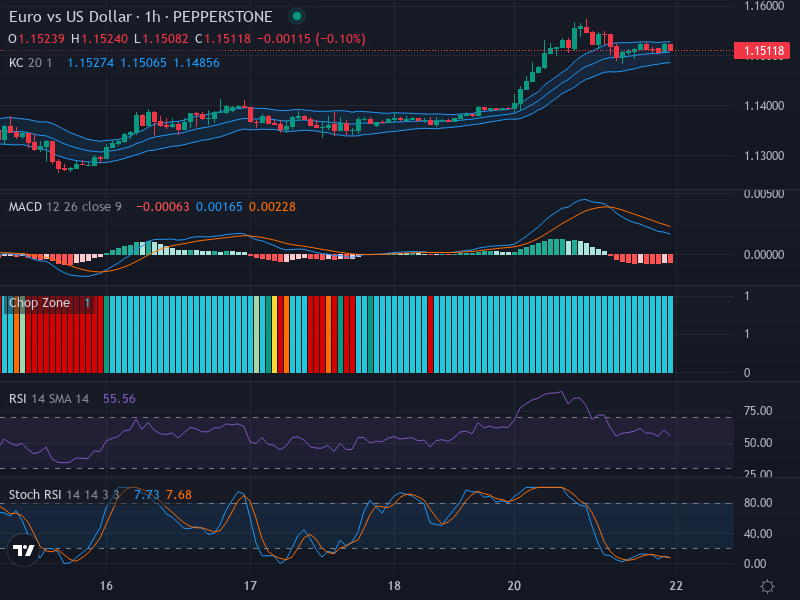
As of today, the Euro versus US Dollar (EUR/USD) currency pair is showcasing a slight downward trend interspersed with periods of consolidation. Currently, the currency pair is trading at 1.15118. While there are no notable bullish or bearish patterns on the candlestick chart, this consolidation around the present price indicates that the market is gearing up for potential shifts.
Technical Analysis
Upon closer examination, we notice the absence of robust bullish or bearish candlestick patterns. However, the current downward market direction, punctuated by brief pauses for consolidation, suggests that traders are keenly watching for significant reversal zones. A key level to focus on is the 1.14850 mark, aligning with the lower band of the Keltner Channel, where the pair previously found strong support.
The Relative Strength Index (RSI), currently at 55.56, further substantiates this somewhat bearish setup. It denotes a market that is neither in an overbought nor an oversold condition. Additionally, with no significant RSI divergence corresponding with the price movement, our predictions remain tethered to existing market conditions.
Exploring the Stochastic RSI, we find the K and D values at 7.73 and 7.68, respectively. These figures, both situated near the oversold region, hint towards a potential buildup of bullish momentum. This perspective does contradict the modest downward drift in price, alluding to an impending market volatility.
Integrating our findings with the MACD analysis reveals a bearish sentiment as the MACD line at -0.00063 is positioned below the signal line at 0.00165. This crossover typically suggests a potential selling opportunity, thus recalibrating our viewpoint with a bearish tilt.
Conclusion and Trading Recommendations
The overall sentiment around EUR/USD leans slightly towards a bearish outlook; however, the likelihood of a reversal cannot be dismissed, especially with insights gained from the Stochastic RSI. Traders are advised to remain vigilant around the 1.14850 support level. A valid long position may be considered if a compelling bullish recovery occurs in that vicinity. Conversely, should the price falter at this support level and the MACD uphold its bearish crossover, pursuing short positions could be wise.
Analyzing Time Frames
- 1-Week Time Frame: The market displays a slight downward movement. The overall bearish sentiment is evident, but consolidation patterns hint at possible recovery points.
- 1-Day Time Frame: Market activity shows resilience at critical support levels, yet the lack of bullish confirmation keeps the outlook cautious.
- 4-Hour Time Frame: Fluctuations indicate indecisiveness; while bearish trends are at play, the proximity of the Stochastic RSI suggests imminent volatility.
Potential Entry Points
- Buy Entry Point: Consider initiating a buy at 1.14900 with a Take Profit of 1.15400 and a Stop Loss at 1.14600.
- Sell Entry Point: Alternatively, a sell strategy can be placed at 1.14780, with a Take Profit target of 1.14400 and a Stop Loss set at 1.14950.
In this analysis, while there are favorable conditions for a Buy scenario given the potential for a bounce off support, the overarching bearish signals suggest that a Sell scenario may have a stronger likelihood of triggering shortly. Effective risk management and careful monitoring will be vital for traders navigating these movements.