Examining Bullish Trends: An In-depth Analysis on Gold vs US Dollar Currency Pair – 29/03/2025
Tháng 3 28, 2025
Sideways Market Movement in Focus as USD/CAD Awaits Breakout – 29/03/2025
Tháng 3 28, 2025Market Overview:
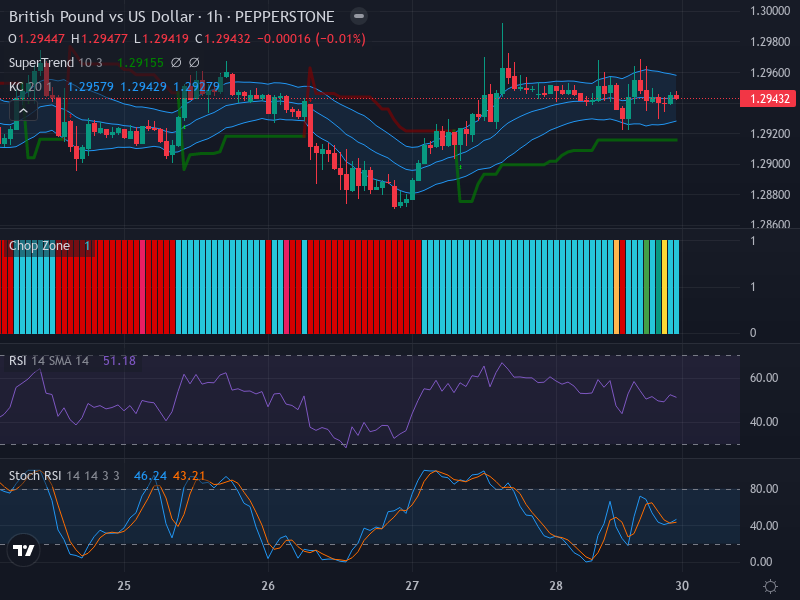
The British Pound (GBP) against the US Dollar (USD) pair is currently experiencing a period of consolidation, as illustrated in the one-hour chart. The pair is idling around the 1.2943 level, suggesting a momentary lack of directional bias from the market players even amidst uncertainties on both sides of the Atlantic. The prevalent candlestick patterns reflect this consolidation phase with no clear signs of immediate bullish or bearish tendencies.
Technical Analysis:
The study of candlestick patterns shows a collection of small-bodied candles floundering around the 1.2943 level. Interestingly, the market isn’t demonstrating any distinct bullish or bearish engulfing patterns, which would typically herald an imminent change in trend direction. Currently, the market direction appears lateral or sideways with potential accumulation zones observed around 1.2920 and 1.2960.
The application of Keltner Channels and Chop Zone Indicators also depicts a market in hibernation. The price dances delicately around the intermediate band of the Keltner Channels, suggesting a neutral long-term trend. This neutral stance is further buttressed by the narrowness of the channels, which highlights rather low volatility. Moreover, a predominantly red Chop Zone cements the proposition of a sideways market.
The Relative Strength Index (RSI), a critical momentum indicator, sits at a nonchalant 51.18. This value shows that the pair is neither overbought nor oversold – again, indicating a market in neutral gear. The sideways trend of the RSI complements the overall market movement and exhibits no discernable change in the immediate future.
Finally, the Stochastic RSI (Stoch RSI), another potent momentum indicator, leads to a similar conclusion. The K and D lines stand at 46.24 and 43.21 respectively, and both traverse through the middle of the range. Despite a few crossovers, their mid-range positions denote neutral momentum.
Conclusion and Trading Recommendations:
Based on the technical analyses, the GBP/USD pair is currently in a deadlock with a reasonably neutral stance. It remains to be seen which catalyst will be strong enough to break this status quo and dictate a new course. Achieving clarity requires careful observation and strategic positioning.
In regard to potential trading actions:
- The 1-week trend is displaying a consolidation pattern, allowing for possible breakout scenarios in either direction as market players await new data.
- The 1-day timeframe suggests that the market lacks sufficient directional momentum, leading to an expectation of continuity in the current price action.
- The 4-hour chart reaffirms a sideways movement with potential entry points emerging around the previously identified accumulation zones.
For traders, the ideal entry points could be as follows:
- Buy Entry Point: 1.2950, Take Profit Point: 1.3000, Stop Loss Point: 1.2915.
- Sell Entry Point: 1.2920, Take Profit Point: 1.2880, Stop Loss Point: 1.2940.
Overall, considering the current signals and extended analysis, a Buy scenario is more likely, provided that the price breaks above the neutral zone established at 1.2950. However, traders must remain vigilant, as sudden shifts in market sentiment could prompt a rapid change.