Ebullient EUR/USD Faces Potential Reversal: A Comprehensive Technical Analysis – 29/03/2025
Tháng 3 28, 2025
GBP/USD Pair Analysis: A Brief Moment of Calm Amidst Turbulence – 29/03/2025
Tháng 3 28, 2025Market Overview
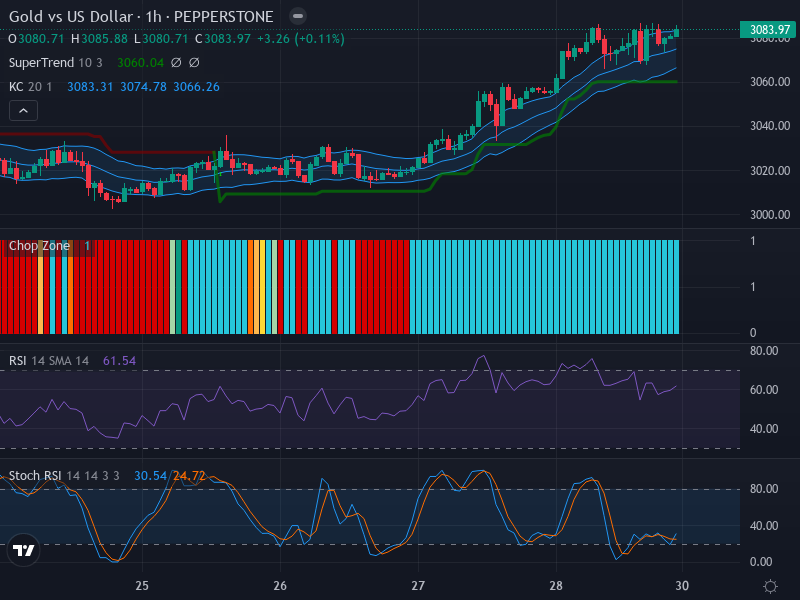
The market landscape for Gold vs US Dollar is currently showcasing a boosted bullish momentum. The trading pair has been steadily moving higher, setting new high barriers, and establishing lower lows on its climb. Traders have increasingly flocked towards this enticing performance, setting the tone for an optimistic market sentiment that anticipates potential growth.
Technical Analysis
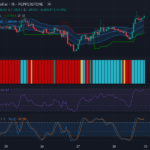
Diving deeper into the technical elements of this currency pair, we observe certain key indicators pointing towards possible future market movements. The Forex chart reveals an upward trend, with higher highs and higher lows apparent. However, some consolidation may take place near the 3080 level, as predicted by candlestick formations.
Despite this consolidation, a potential zone of retracement around the 3060 level may be on the horizon. Here, the previously set support line could provide a buffer for the currency pair. This implies a potential for growth trajectory continuation after this minor pullback.
When it comes to indicators like the Relative Strength Index (RSI), the value is currently at 61.54, posing between neutral and slightly overbought territory. While this might suggest caution is due regarding a potential pullback, it mostly reinforces the continuation of steady upward movement.
Adding to the commentary is the Stochastic RSI analysis, which exhibits a K-value of 30.54 and a D-value of 24.72. These indicators signify that the pair is currently in the neutral zone but is nearing a potentially oversold state. Given this condition, a further rebound is predictable, thus supporting a short-term upward momentum.
Analyzing views in terms of the Keltner Channels and Chop Zone, the price is marked above the middle EMA 20 band, signifying a pronounced upward trajectory. This trend is backed by some level of volatility as indicated by the expansion of channels. The primarily light-blue color characteristic of the Chop Zone hints at a significant trending market as opposed to sideward movement.
Conclusion and Trading Recommendations
Looking at the data from various timeframes (1-week, 1-day, and 4-hour periods), the bullish trend appears prevalent. This upward trend is further boosted by fundamental factors for the 1-week timeframe. The 1-day period presents a potential consolidation phase that could lead to a continuation of the overall trend. In a 4-hour context, there’s a possibility for retracement, but it doesn’t lessen the underlying strength of the upward trend. Therefore, given the above scenarios and indicators, our recommendation is to plan longer-term buy trades around the potential retracement zone, as the overall upward trend is likely to persist.
Analysis of Time Frames
- In the 1-week timeframe, a strong bullish outlook is supported by fundamental factors, reflecting an enduring demand.
- The 1-day timeframe showcases potential consolidation but holds the promise of continuation in the bullish trend.
- In the 4-hour timeframe, signs of retracement are present; however, they do not undermine the established bullish strength.
Potential Entry Points
Considering the analysis from various indicators and time frames:
- Buy Entry Point: At 3065, Take Profit at 3110, Stop Loss at 3050.
- Sell Entry Point: At 3080, Take Profit at 3040, Stop Loss at 3095.
Based on the overall analysis, a Buy scenario appears more likely to occur due to the prevailing bullish indicators across multiple time frames.