3 Reasons Joel Greenblatt Says Value Investing Beats the Market
Tháng 3 28, 2025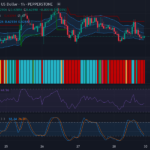
Australian Dollar vs US Dollar: A Detailed Technical Analysis and Potential Trade Opportunities – 29/03/2025
Tháng 3 28, 2025Market Overview
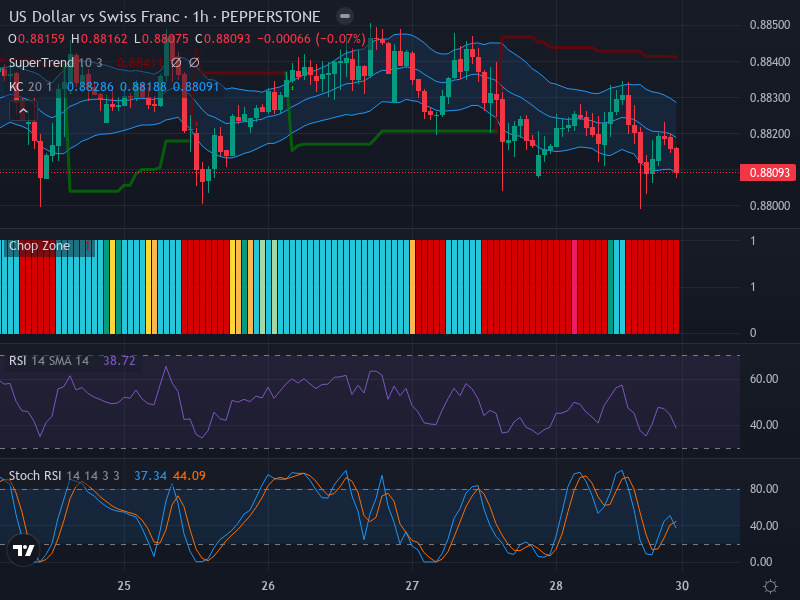
The Forex market trading pair US Dollar vs Swiss Franc (USD/CHF) is currently nursing a predominantly sideways trend. Market participants are experiencing indecisiveness as reflected by the small candlestick bodies and equal lengths of wicks on the chart. Though the market direction remains neutral, a slight leaning towards a bearish sentiment is notable.
Technical Analysis
The chart paints an unclear picture of the market direction. The key resistance and support levels are clustered rather close at 0.8825 and 0.8800 respectively, indicating narrower trading ranges and intensified price compression.
Turning our attention to the Relative Strength Index (RSI), the figure stands at 38.72. This positions the USD/CHF pair in the lower end of the scale, edging the market towards the oversold region. While this stockpile of sell-offs could drive the market further down, it also leaves room for a potential bullish rebound should the oversold conditions deepen. As of now, no clear divergences are visible between the RSI and market price movement, making the market direction unpredictable.
The Stochastic RSI (Stoch RSI) likewise provides an interesting perspective. The tabulated Stoch RSI K line and D line stand at 37.34 and 44.09 respectively. The observed crossover, with the K line slipping underneath the D line, signals a short-term bearish trajectory. Moreover, this bearish divergence underlines the potential for further downside momentum, reinforcing the minor bearish sentiment witnessed on the chart.
Finally, the Comparative Analysis Using Keltner Channels and Chop Zone verifies the bearish view. The price movement is brushing against the lower band of the Keltner Channels. This proximity to the lower band infers the prevalence of a bearish stance in the market, although still leaning towards the sideways zone.
Conclusion and Trading Recommendations
Given the mixed signals floating around the USD/CHF technical chart, traders might want to adopt a wait-and-see approach for clarity on the market direction. It would be prudent to monitor the resistance and support levels of 0.8825 and 0.8800 respectively for breakout confirmations. Meanwhile, the bearish slant to the overall market dynamics might offer potential short opportunities, though one needs to keep an eye out for sudden bullish reversals considering the oversold conditions.
Summary of Technical Analysis
- 1-Week Trend: The weekly timeframe indicates a neutral trend, staying within the bounds of previous support and resistance levels, generally indicating consolidation.
- 1-Day Trend: On the daily scale, the USD/CHF shows short-term bearish momentum, influenced by the current RSI and Stochastic readings, suggesting potential sell-offs.
- 4-Hour Trend: The four-hour view reflects a sideways market with minor bearish inclines, underscored by the proximity to the Keltner Channel lower band.
Potential Entry Points
Considering all analyzed indicators:
- Buy Entry Point: 0.8810, Take Profit Point: 0.8850, Stop Loss Point: 0.8790.
- Sell Entry Point: 0.8790, Take Profit Point: 0.8760, Stop Loss Point: 0.8805.
In this analysis, the Sell scenario appears more likely, especially given the current bearish sentiment and market conditions, although monitoring for potential bullish reversals is essential.