
GBP/USD Technical Analysis: A Possible Momentum Shift in the Offing – 18/04/2025
Tháng 4 17, 2025
US Dollar versus Japanese Yen: A Technical Review Amidst Sideways Market Movements – 18/04/2025
Tháng 4 17, 2025Market Overview
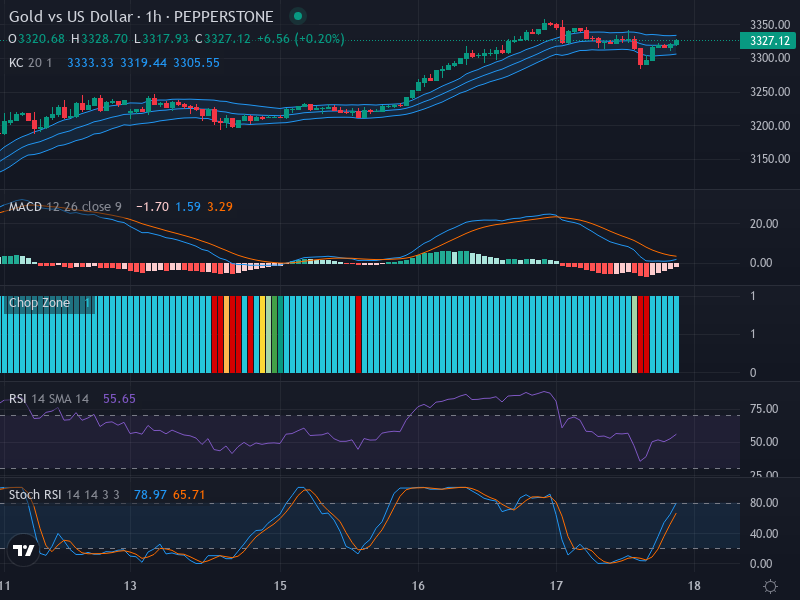
The Gold versus US Dollar currency pair, currently valued at $3327.12, has captured the attention of traders and analysts alike due to notable shifts in its price patterns. Following a recent retracement phase, the latest series of candlesticks suggests an upward bias, indicating the potential for bullish momentum. However, the lack of significant bullish or bearish formations, such as engulfing patterns or dojis, highlights the need for a careful approach from traders and investors.
Technical Analysis
A closer inspection of the candlestick pattern reveals that the current setup leans towards the bulls. A critical surge zone appears to be forming above the $3350 mark, which aligns with a key resistance level around the upper Keltner Channel.
Delving into the Relative Strength Index (RSI), the current reading stands at 55.65, which remains neutral and does not suggest a strong preference for either the overbought or oversold positions. While the RSI slightly favors a northward trend, traders should remain cautious, as its proximity to the neutral level may lead to unpredictable price movements.
Further examination of the Stochastic RSI shows the K line at 78.97, sitting above the D line at 65.71. This configuration hints at potential bullish momentum. However, the K line’s approach to the overbought zone necessitates careful observation, as it could signal an impending retracement.
Additionally, the Moving Average Convergence Divergence (MACD) plays a pivotal role in this technical evaluation. With a MACD Line at -1.70 and a Signal Line at 1.59, a bearish crossover appears to be imminent. Nevertheless, the fluctuating histogram bars are currently diminishing in negativity, possibly indicating a reversal of momentum on the horizon.
Conclusion and Trading Recommendations
Taken together, the analysis from candlestick patterns, RSI, Stochastic RSI, and MACD suggests a scenario that is cautiously optimistic. There are clear indicators of a potential revival of bullish momentum; however, vigilance is critical. Traders should monitor movements around the resistance zone, the RSI’s proximity to a neutral reading, the K line nearing overbought territory, and the signs of a momentum reversal via MACD indicators.
For those considering trading, a prudent approach would be to wait for more definitive signals before committing fully. Conversely, traders may opt to enter cautiously, employing tight stop-loss orders near key resistance levels to take advantage of potential short-term upward movements.
Market Trends and Entry Points
- 1-Week Trend: Bullish sentiment is indicated as prices have been generally rising, supported by strong fundamentals, with the potential for further upside if resistance levels are broken.
- 1-Day Trend: A neutral to bullish trend, suggesting that while recent price movements are promising, caution on entry points remains advisable due to the lack of significant momentum.
- 4-Hour Trend: Slightly bullish, with indications of upward movements, but volatility remains a concern due to proximity to overbought conditions.
Considering these trends, potential entry points could be structured as follows:
- Buy Entry Point: $3352, Take Profit Point: $3380, Stop Loss Point: $3345. This setup relies on breaking the resistance zone and is anchored by the candlestick analysis and moving averages.
- Sell Entry Point: $3320, Take Profit Point: $3305, Stop Loss Point: $3325. This conservative position allows for profit capture should the price reverse.
Overall, the analysis leans towards a more Buy scenario, as bullish indicators begin to surface, albeit accompanied by necessary caution.


