
US Dollar vs Canadian Dollar: A Technical Deep Dive into The Downward Momentum – 18/04/2025
Tháng 4 17, 2025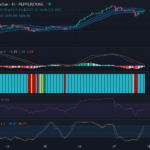
Bullish Momentum on Horizon for Gold vs US Dollar – A Technical Outlook – 18/04/2025
Tháng 4 17, 2025Market Overview
As we delve into the Forex marketplace, our focus today rests on the GBP/USD currency pair. Presently, the pair stands at 1.32675, and it displays a mild upward direction. This trend is reflected by recent candlesticks registering higher highs. However, an absence of particularly robust bullish or bearish candlestick formations combined with a potential retracement zone around 1.3250 signals an evolving market environment.
Technical Analysis
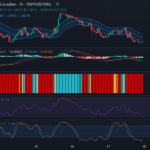
The recent course of the GBP/USD pair has been intriguing, influenced by a myriad of technical indicators. As an initial indicator, the Relative Strength Index (RSI), standing at 58.66, suggests a neutral market scenario, albeit with a slight veer towards possible overbought conditions. The non-existing divergence coupled with this indicator fortifies the validity of the ongoing upward trend, albeit gently.
Moreover, the Stochastic RSI, another crucial momentum oscillator, reinforces this prediction. With the K Line at 74.65 and D Line at 78.04, we find the pair in the overbought territory. A recent bearish crossover observed within these values might be forewarning of a forthcoming momentum reversal, intensifying the anticipation surrounding the GBP/USD pair’s next steps.
Adding to this milieu of indicators, MACD analysis sheds auxiliary light on the GBP/USD’s present situation. It displays a bearish crossover with the MACD Line at 0.00022 and the Signal Line at 0.00061. The gradually declining Histogram bars sustain our earlier proposition of dwindling bullish momentum, suggesting a potential pause or reversal in the short-term trend.
Delving deeper, the use of Keltner Channels and Chop Zone adds further dimensions to our analysis. Here, we notice the price standing above the middle band of EMA 20 of the Keltner Channels. It is a strong hint at a longer-term uptrend. Yet, the emergence in the Chop Zone indicates the market’s potential transition.

Conclusion and Trading Recommendations
Drawing upon the intricate analysis laid out, the GBP/USD pair appears to straddle a crucial crossroads. Despite the evident long-term upward trend, the imminent short-term reversal forecasted by multiple indicators prompts market players to exercise caution. Still, traders can keep an eye for a possible short-term reversal or pause in the current trend. For investors favoring the long-term, riding the longer-term upwards trend might prove beneficial.
1-Week, 1-Day, and 4-Hour Trends
- The 1-week trend shows a consistent uptrend with minimal retracements, but caution is warranted.
- The 1-day trend indicates signs of volatility and possible correction as bearish signals emerge.
- The 4-hour trend is exhibiting signs of stalling momentum, suggesting a potential reversal may be at hand.
After thorough analysis, potential entry points based on the 1-hour timeframe are identified as follows:
- Buy Entry Point: 1.3275, Take Profit: 1.3315, Stop Loss: 1.3250.
- Sell Entry Point: 1.3250, Take Profit: 1.3210, Stop Loss: 1.3270.
Based on the analysis of these indicators, a Sell scenario seems more likely given the signs of a slowing upward momentum and potential bearish reversal.


