
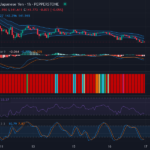
USD/JPY: A Technical Outlook Amid Downward Pressure – Opportunity for Potential Buy? – 17/04/2025
Tháng 4 16, 2025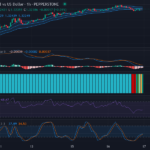
GBP/USD Market Analysis: Potential for Short-Term Bullish Movement Amidst Sideways Trend – 17/04/2025
Tháng 4 16, 2025Sure! Here’s the content with the specified image placed before the Conclusion:
Market Overview
In the global Forex landscape, the gold against the US dollar (XAU/USD) pair presents interesting dynamics. Presently registering at a value of 3351.72, the market channels a bullish vibe with an upwards trend. The role of the US dollar as a global reserve currency epitomizes the importance of examining this currency pair, given the macroeconomic implications it carries.
Technical Analysis
Analyzing the candlestick patterns, we notice a series of green candles highlighting a robust upwards tendency. Market enthusiasts might expect resistance near the recent high, while the last breakout point in the vicinity of 3300 could serve as a potential support area.
Diving deeper into the analysis through the Relative Strength Index (RSI), it is apparent this market is overbought, indicated by a high value of 88.21. While this generally warrants the potential for a price pullback, it also fortifies the upward trend’s strength, and our analysis reveals no significant divergence between the RSI and the price trend.
The Keltner Channels also direct us towards a bullish momentum, with the price comfortably positioned above the middle band. As the channels widen, we can interpret an increase in market volatility. Simultaneously, the Chop Zone analysis manifests a trending market situation with predominant blue bars interspersed with occasional red, signaling minor instances of price retracement.
Turning our attention to the Stochastic RSI (Stoch RSI), both K and D lines manifest themselves in the overbought territory, recording values of 96.36 and 89.97 respectively. This could suggest a potential for trend continuation, but also hints at possible short-term fallbacks.
Lastly, with the MACD line at 24.75 staying above the Signal line at 23.08, the market emanates a vigorously bullish indication, signifying the ascendency of the buying force.

Conclusion and Trading Recommendations
The current market conditions pose a strong bullish scenario for the Gold vs. US Dollar currency pair. Considering the upward trajectory, traders might consider going long on this pair to capitalize on the sustained uptrend. However, one should also be aware of the looming pullback potential due to the market being in an overbought state. Thus, it may be prudent to wait for minor pullbacks or for the Stoch RSI to exit the overbought territory before entering a long position.
In conclusion, here’s a concise analysis of the market based on the 1-week, 1-day, and 4-hour time frames along with potential entry points:
- In the 1-week time frame, the trend remains strongly bullish, indicating robust buying sentiment with no immediate signs of reversal.
- The 1-day time frame showcases consistent bullish momentum, reinforcing the ongoing positive price action and the strength of recent green candles.
- The 4-hour time frame exhibits volatility with minor pullbacks; however, the bullish trend remains intact, suggesting quick buying opportunities amid price reactions.
Based on this analysis, potential entry points for trading the XAU/USD pair are identified:
- Buy Entry Point: 3360, Take Profit Point: 3400, Stop Loss: 3330.
- Sell Entry Point: 3340, Take Profit Point: 3300, Stop Loss: 3360.
Considering the analysis of the indicators and tools, a Buy scenario seems more likely to occur, with the potential for continued upward movement despite short-term pullbacks. Always stay cautious and manage risks accordingly.


