
Lateral Consolidation Observed in Euro vs US Dollar FX Trading – 16/04/2025
Tháng 4 15, 2025
Upward Journey Continues for USD/CAD Despite Overbought Signals – 16/04/2025
Tháng 4 15, 2025Market Overview
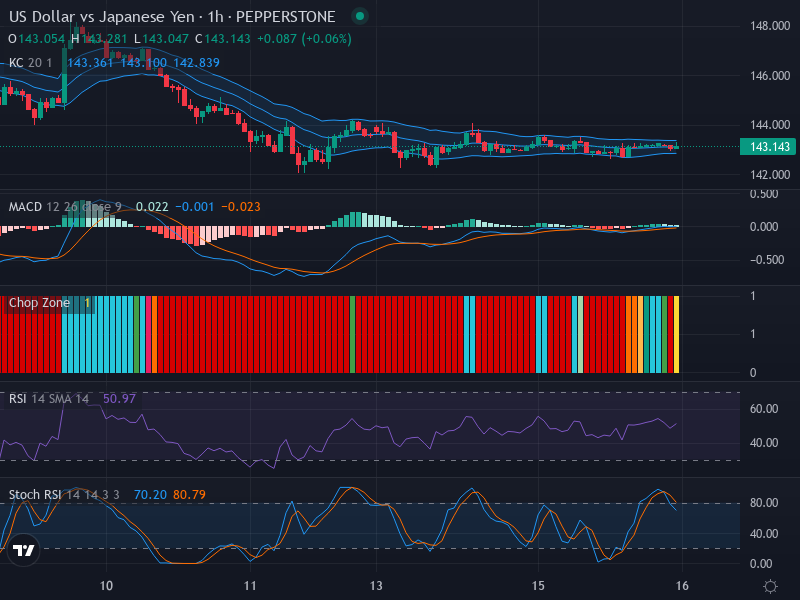
The USD/JPY Forex market has recently presented a phase of neutrality, with the price hovering sideways along the Keltner Channels. Currently priced at 143.143, the market is signifying a consolidation phase. Despite this flat movement, an uptick in trading action could be triggered by the breakout of significant levels that have held the pair in its stifling range.
Technical Analysis
The pair has failed to establish a clear directional bias, as evidenced by the recent candlestick pattern trading between resistance and support levels at 143.500 and 142.500, respectively. As the Keltner Channels indicate, price is treading near the middle band, which, coupled with the contraction of channels, portrays a low-volatility phase.
The Relative Strength Index (RSI), currently valued at 50.97, supports the ongoing lateral action, as it sits at the equilibrium—denoting neither overbought nor oversold conditions. This neutrality aligns with the pair’s flightless trend and further confirms the consolidation phase. The series of red bars displayed by the Chop Zone indicator further echoes this sideline mode of the USD/JPY.
Contrarily, the Stochastic RSI (Stoch RSI) somewhat defies the prevailing neutrality, with current K and D values at 70.20 and 80.79, respectively. A recent bearish crossover near the overbought region shines a light on a potential upswing in bearish momentum, contradicting the underlined neutral market stance.
Furthermore, the Moving Average Convergence Divergence (MACD) offers little testament to any solid momentum. The MACD line sits just below the signal line, indicating a minor bearish bias, subtly underplaying the absence of robust bullish or bearish trends.
Conclusion and Trading Recommendations
In conclusion, the current state of the USD/JPY Forex market is tightly anchored in a neutral arena. The consolidated phase could rekindle interest when the price breaks the iteration at levels 143.500 or 142.500. Meanwhile, traders are recommended to remain in an observant mode until a clear trend surfaces.
Given the bearish crossover of Stoch RSI, short-term traders could anticipate a period of bearish momentum. However, the general market neutrality signaled by the RSI, MACD, and Keltner Channels suggests that any bearish momentum might be short-lived and insufficient to disrupt the overall inertia.
Trend Analysis:
- 1-Week Time Frame: The USD/JPY pair shows a consolidation pattern, indicating a neutral trend with potential breakout points.
- 1-Day Time Frame: The market remains stable, fluctuating within the established support and resistance range.
- 4-Hour Time Frame: A minor bearish signal emerges, yet it lacks strength to suggest a definitive downward movement.
Given the analysis across various time frames, potential entry points at the 1-Hour Time Frame are as follows:
- Buy Entry Point: 143.150, Take Profit Point: 143.400, Stop Loss Point: 143.000
- Sell Entry Point: 142.850, Take Profit Point: 142.600, Stop Loss Point: 143.000
Overall, the analysis indicates that a Sell scenario may be more likely to manifest, given the bearish momentum outlined in the indicators. Traders are advised to stay vigilant for price movements near the breakout levels.


