
US Import Prices and NY Fed Manufacturing Index Driving USD Volatility
Tháng 4 15, 2025US Import Prices and NY Fed Manufacturing Index Trigger Dollar Volatility
Tháng 4 15, 2025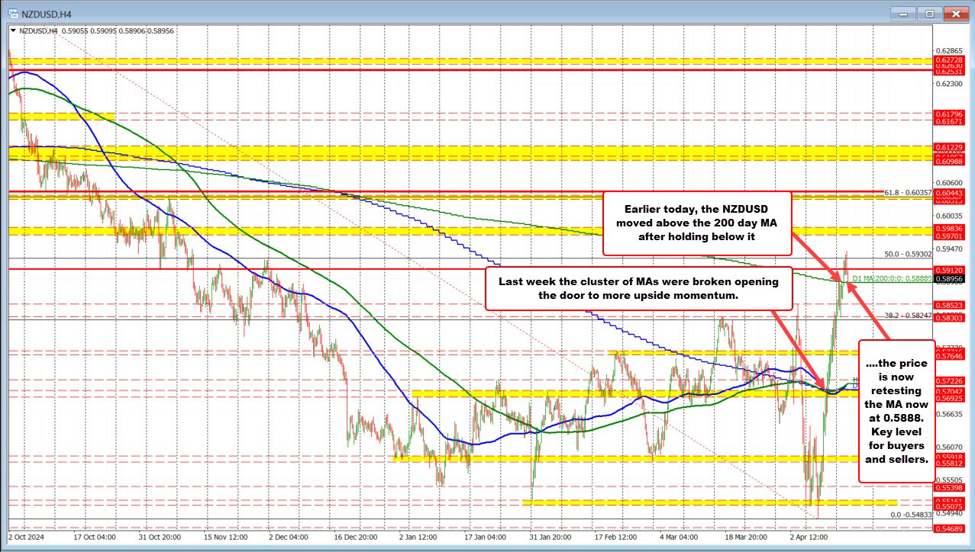
NZD/USD Pair Emerges Strong After Retesting 200-Day Moving Average
In recent market developments, the NZD/USD currency pair has garnered attention by retesting the 200-day moving average, marking a significant milestone since surpassing this level for the first time since October 2024. This technical shift highlights a pivotal moment for traders and investors, prompting a closer examination of the factors influencing this trend.
Wave Analysis and Market Sentiment
The NZD/USD pair has successfully broken through a resistance zone, paving the way for a potential rise towards the critical resistance level of 0.5930. This uptick is fundamentally driven by bearish sentiment surrounding the US dollar, which has created a ripe environment for the New Zealand dollar to strengthen. Analysts have noted that this movement aligns with a broader trend within the currency market, bolstered by ongoing economic indicators that favor the Kiwi. As bearish pressure mounts on the US dollar, the outlook for NZD seems increasingly optimistic, and traders are keenly observing these developments as they unfold.
For further insights on currency pairs and their market trends, you may want to explore this analysis on the neutral trend in forex markets which discusses the indecisiveness and volatility between the USD and CAD.
Technical Insights: A Bullish Picture
From a technical analysis perspective, findings on the 4-hour timeframe reveal promising signals for the NZD/USD pair. It has been rising above the 200-period moving average, a significant indicator of overall market health. Indicators such as the Moving Average Convergence Divergence (MACD), Donchian Channel, and Fractals are indicating a favorable buying position for traders. However, caution is warranted as the Relative Strength Index (RSI) has entered an overbought zone, suggesting that while the momentum is strong, a pullback could occur. Traders must remain vigilant, as market conditions can shift rapidly in response to new information or economic releases.
Additionally, if you’re tracking the GBP/USD, it may be beneficial to read about the current neutral range of the GBP/USD currency pair which reflects a lack of volatility and directional trends similar to the NZD/USD’s performance.
Elliott Wave Theory Forecasts Further Upside Potential
Employing Elliott Wave Theory, some market analysts posit that the NZD/USD could potentially enter a Wave C phase. If this hypothesis holds, traders might anticipate further upside momentum, targeting levels around the 0.6677 mark. A corrective pullback during Wave 2 is often seen in such scenarios, presenting potential buying opportunities for those strategically positioned.
Fundamental Drivers: Inflation Supporting the NZD
Fundamentally, rising food price inflation in New Zealand contributes to a bullish outlook for the NZD/USD pair. A stronger inflation environment can bolster the currency as the central bank may adopt a more hawkish stance, potentially leading to interest rate increases. This economic backdrop is influential for currency traders, as higher rates typically support stronger currency performance.
For those interested in further analysis similar to the NZD/USD scenario, consider the insights from the EUR/USD analysis which discusses currency strength and market movements.
As New Zealand moves forward, the interplay of inflation and currency strength will be closely monitored by market participants.
In conclusion, the recent behavior of the NZD/USD pair underscores a complex yet potent blend of technical advantages and fundamental support that points towards a potentially bullish trajectory. As the economic landscape continues to evolve, traders and investors must remain alert to both chart developments and key economic indicators that could further influence this dynamic currency pair.