Euro vs US Dollar Forex Analysis: Identifying the Bullish Momentum Amid Consolidation – 28/03/2025
Tháng 3 27, 2025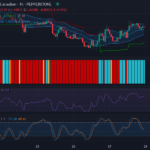
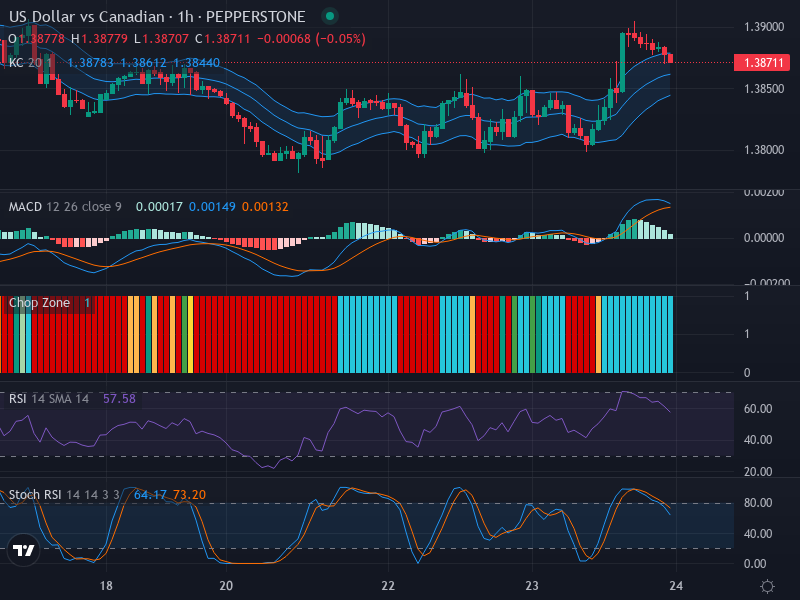
Neutral Undertones Shaping the Short-term Market Outlook for USD/CAD – 28/03/2025
Tháng 3 27, 2025Market Overview
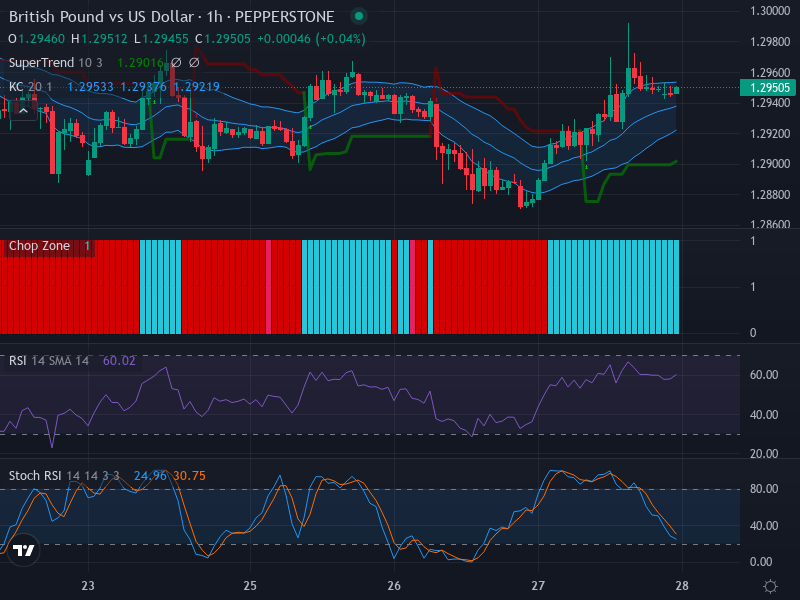
The GBP/USD pair appears to be coiled up inside a technically neutral zone, as per the recent 1-hourly chart analysis. Notwithstanding minor fluctuations, the market seems to be adopting an overall lateral movement without decisive upward or downward direction. There is no sharp symphony of bullish or bearish patterns such as dojis or hammers looming over recent charts.
Technical Analysis
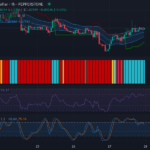
Tunneling into candlestick patterns, the GBP/USD market is erring toward minor bullishness. Pinpointed resistance hovers around 1.2960, whilst a level of support cradles the lower limit at approximately 1.2925. However, the absence of major candlestick patterns delivers no robust indication of a significant price movement.
The Relative Strength Index (RSI) stands at 60.02 – not quite into overbought territory but tipping slightly to the bullish side. Further consolidating these subtle bullish tendencies, there is an apparent coherence between the lateral trend and RSI standings. Nonetheless, an inspection for divergences yields no valuable insights as of yet.
Casting a gaze over the Keltner Channels and Chop Zone, the middle of the EMA 20 band is parked closely to the current price. This suggests that the dominant trend remains neutral. The market appears to lack notable volatility as inferred through the gentle channel expansions. Furthermore, the ongoing prevalence of blue bars in the Chop Zone substantiates the continued sideways market movement. From the amalgamation of these indicators, there isn’t a clear sign pointing toward an imminent breakout.
Stochastic RSI scrutiny, though incomplete, should play a crucial role in elaborating on these signs, potentially highlighting any momentum shifts in the market.
Conclusion and Trading Recommendations
As of the present, GBP/USD seems to be draped with the cloak of neutrality. Without clear signs of a breakout, readers are advised to proceed with caution and keen observance. Swing traders might find this contention between the slight bullish inclination and overall neutrality very intriguing.
Investors may want to adopt a ‘wait and see’ approach until stronger, more discernible signals are present. For risk-averse traders, maintaining the current position could be optimal. On the contrary, risk-tolerant bulls might consider small-sized bets on the pair continuing its minor bull run. A stop loss at the support level around 1.2925 may be wise should the bulls fail to drive prices upwards.
Trend Analysis and Entry Points
1-Week Time Frame: The broader trend remains neutral, with no decisive directionality observed.
1-Day Time Frame: Mild bullish signals are noted, but a distinct upward momentum is lacking.
4-Hour Time Frame: Sideways movement continues, suggesting an equilibrium in buying and selling pressures.
Given this analysis, potential entry points can be formulated. For a Buy scenario, consider entering at 1.2950, with a Take Profit point at 1.2980 and a Stop Loss set at 1.2920. For a Sell scenario, consider entering at 1.2935, with a Take Profit point at 1.2910 and a Stop Loss at 1.2965.
With the current bullish inclination overshadowed by lateral neutrality, a Buy scenario appears slightly more favorable, but strict risk management is essential.