
Forex Analysis: EUR/USD Sideways Consolidation Expected to Continue on Hourly Chart – 15/04/2025
Tháng 4 14, 2025
Neutral Ground for USD/CAD – A Transition from Downward to Sideways – 15/04/2025
Tháng 4 14, 2025Market Overview
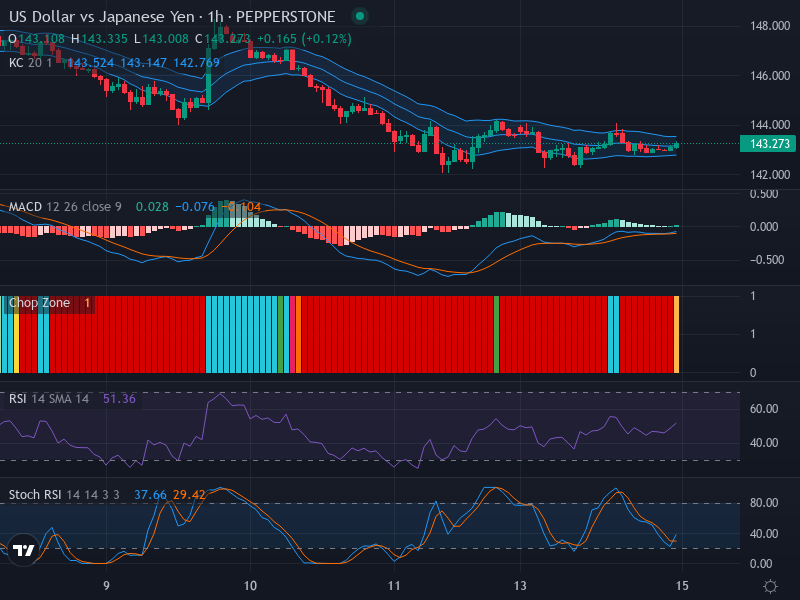
The Forex market, specifically the USD/JPY currency pair, is currently hovering near 143.273, manifesting a lateral market direction. This means that the pair is stuck in an indecisive stage, with market participants waiting for the next major driver to push the prices out of the ongoing consolidation phase. However, the price seems to be leaning towards a minor bullish bias, given the upward pressure from recent candles that have been consistently orbiting around the middle band of the Keltner Channels.
Technical Analysis
The careful examination of the candlestick pattern shows a potential consolidation happening near the 143.273 level. The currency also seems to be contending with a possible upper limit at the mark of 144, an area of crucial resistance defined by the upper tier of the Keltner Channels. A decisive closing above this level can lead to the acceleration of positive momentum.
In terms of the momentum indicators, the Relative Strength Index (RSI) sits at a neutral level with a value of 51.36, implying that the market is neither in overbought nor oversold conditions, conforming with the sideways market situation. Correspondingly, no significant divergences have been detected between the price motion and RSI, thereby solidifying the confirmation of the ongoing market consolidation.
The Stochastic RSI (Stoch RSI), a popular momentum oscillator, also contributes to the neutral to mildly bullish outlook. Outlined at the current metrics of K line at 37.66 and D line at 29.42, it is hinting at a potential bullish crossover, which could lead to some short-term upward swings.
The Moving Average Convergence and Divergence (MACD) indicates a similar pattern to the Stoch RSI, with a bullish crossover suggesting potential upward momentum. With the MACD line standing at 0.028, it recently crossed above the signal line valued at -0.076. The MACD histogram also portrays a promising image with its rising bars emphasizing the likelihood of a bullish sentiment.
Conclusion and Trading Recommendations
This comprehensive analysis of the USD/JPY indicates a somewhat mixed climate, combined with a pendulum movement accompanied by the potential for bullish momentum. With this in mind, traders could:
1-Week, 1-Day, and 4-Hour Trend Analysis
- The 1-week trend suggests a consolidation phase with prices fluctuating within a range, indicating indecision among traders while showing signs of potential bullish pressure.
- The 1-day analysis reflects a similar narrative, presenting a mild upward bias but still trapped beneath the key resistance near 144.
- The 4-hour trend signifies a bullish momentum buildup as indicated by oscillators such as the MACD and the Stoch RSI, reinforcing the expectation of an imminent breakout.
From there, potential entry points at the 1-hour time frame based on multiple indicators could be identified as follows:
- Buy Entry Point: 143.400, Take Profit Point: 144.000, Stop Loss Point: 143.150.
- Sell Entry Point: 143.000, Take Profit Point: 142.500, Stop Loss Point: 143.150.
In conclusion, a Buy scenario seems more likely to occur given the evidence of bullish momentum from momentum indicators and price action, coupled with a potential break above the significant resistance level. Nevertheless, it remains vital for traders to exercise caution and use adequate risk management strategies as the market may still oscillate within its current range.


