
Japan’s Finance Minister Shunichi Kato on FX Volatility: A Call for Market Stability
Tháng 4 14, 2025
Navigating the Gold vs US Dollar Forex Market Amid Sideways Direction: A Technically-Centric Study – 15/04/2025
Tháng 4 14, 2025Market Overview
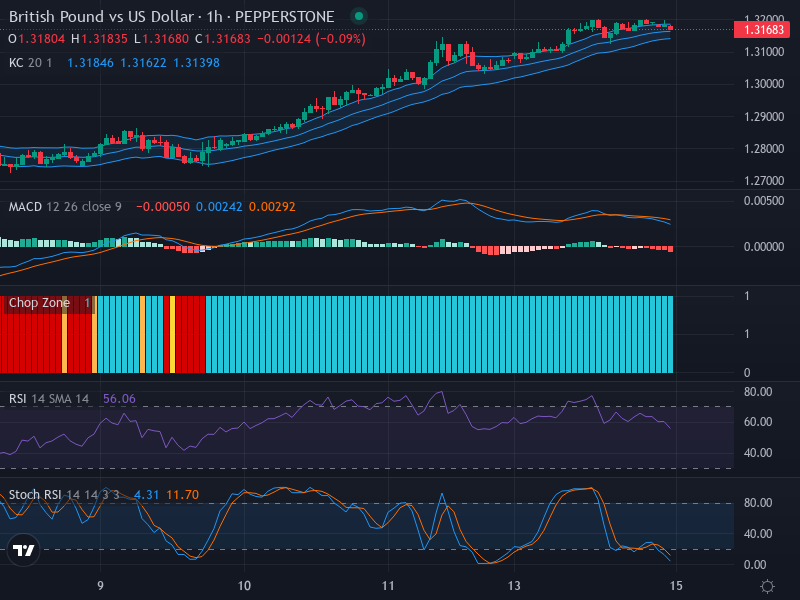
The GBP/USD currency pair, a highly dynamic Forex currency cross, currently trades at around 1.31683. Market movements exhibit minor fluctuations and short-term indecision, even as the broader market sentiment leans towards a bullish trend. Influences from Brexit-related news and shifts in US economic data amplify the market dynamics, creating an atmosphere ripe for volatility.
Technical Analysis
The latest candlestick configuration on the GBP/USD chart reveals a sequence of small-bodied candlesticks. This pattern signifies short-lived oscillations and a noticeable level of market inconsistency. However, it is significant that this pattern resides above the Keltner Channel’s median band, indicating a latent bullish preference among market participants and raising the probability for the currency pair to move upwards.
When examining the Relative Strength Index (RSI), it currently sits at 56.06, reflecting a mildly bullish undertone. The lack of notable divergence between the RSI reading and price progression suggests a balanced interplay between supply and demand in the market.
Additionally, the Stochastic RSI shows values for K and D at 4.31 and 11.7, respectively. These figures broadly indicate a potential oversold condition, possibly setting the stage for an upward price reversal, particularly if corroborated by other market indicators. The Stochastic RSI’s K line, currently below the D line, enhances the likelihood of an impending upward movement.
An analysis of the Moving Average Convergence Divergence (MACD) unveils more critical insights. The MACD line sits slightly below the Signal line, at 0.00242 compared to 0.00292, indicating a gentle bearish momentum. Further scrutiny of the MACD histogram suggests a waning bearish influence, hinting at a possible reversal or exhaustion of the current downtrend.
Conclusion and Trading Recommendations
Overall, the technical landscape for GBP/USD supports the emergence of a bullish direction. Factors driving this expected upswing include indications of potential oversold conditions, a fading bearish momentum, and the price movements above the Keltner Channel’s median line.
Analysis of Time Frames
- The 1-week time frame shows a solid bullish trend driven by positive macroeconomic indicators from the UK, suggesting continued upward movement.
- The 1-day time frame displays mixed signals with some consolidation patterns, yet higher lows indicate prevailing bullish sentiment.
- The 4-hour time frame presents opportunities for short-term traders, as the bullish momentum appears to gather strength with each passing session.
In light of this analysis, potential entry points emerge in the 1-hour time frame through the application of indicators and tools discussed. Specific scenarios might unfold:
- Buy Entry Point: 1.3170, Take Profit Point: 1.3240, Stop Loss Point: 1.3130.
- Sell Entry Point: 1.3145, Take Profit Point: 1.3100, Stop Loss Point: 1.3160.
The prevailing conditions suggest a Buy scenario is more likely to materialize based on optimistic movement trends and indicators, despite existing short-term sell signals. Traders should be vigilant and ready to capitalize on this upward trajectory while managing their risk appropriately.


