Analyzing the Bearish Tendencies in NZD/USD Market: A Comprehensive Review – 28/03/2025
Tháng 3 27, 2025
Euro vs US Dollar Forex Analysis: Identifying the Bullish Momentum Amid Consolidation – 28/03/2025
Tháng 3 27, 2025Market Overview
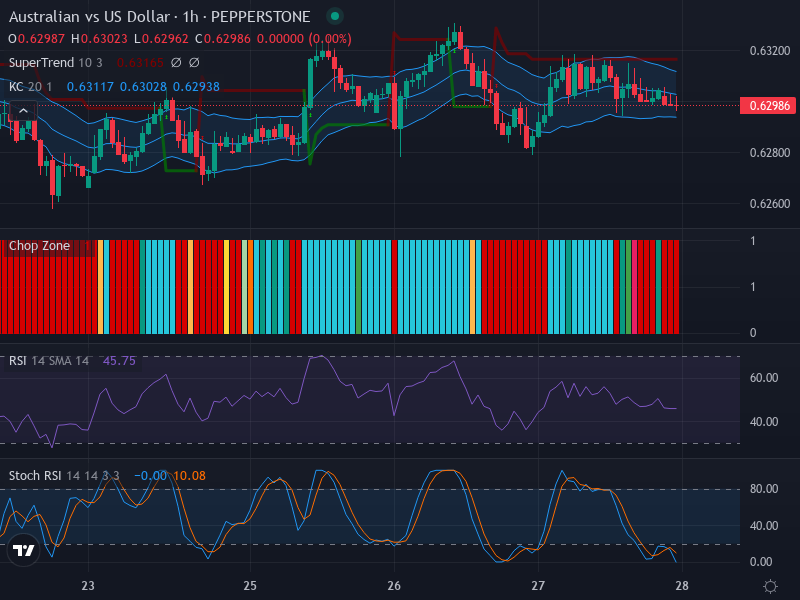
The latest insights into the AUD/USD pair, gathered from the 1-hour chart provided on Pepperstone, present a comprehensive understanding of the current Forex landscape. The ongoing trading environment reveals a range-bound market, confirmed through periodic fluctuations within the Keltner Channels.
Technical Analysis
a. Candlestick Pattern:
The AUD/USD is clearly exhibiting a lateral market trend at this juncture, with the absence of specific bullish or bearish candlestick formations. The currency pair, for the most part, adheres closely to the middle band of the Keltner Channel—a 20-day exponential moving average—highlighting a sideways movement. This stability in the price pattern diminishes the probability of sharp price surges or dramatic retracements in the near term.
b. Relative Strength Index (RSI):
The RSI stands at 45.75, implying a marginally oversold condition. The neutrality shown by the RSI somewhat aligns with the sideways market activity indicated by the candlestick patterns. There’s an evident lack of substantial momentum to push the AUD/USD pair into a pronounced uptrend or downtrend. Furthermore, we don’t observe any conspicuous divergences between the RSI and the price action.
c. Stochastic RSI (Stoch RSI):
The Stoch RSI depicts a cross-over in the picture with a K line value at -0.00 and a D line value at 10.08. While this could typically be deemed as a bullish signal, it’s crucial to bear in mind that the observed cross-over resides in the lower region. Therefore, in the context of the prevailing neutral RSI, these readings should be scrutinized carefully as they do not offer strong support for a predominant market trend.
d. Keltner Channels and Chop Zone:
Consistent with the other indicators, the Keltner Channels confirm a sideways market trend, with prices routinely oscillating around the intermediate band. The Chop Zone remains unspecified.
Conclusion and Trading Recommendations:
Based on the technical diagnosis of the AUD/USD pair, traders may want to adopt a flexible strategy. The analysis across various time frames, including the 1-week, 1-day, and 4-hour intervals, indicates the following:
- In the 1-week time frame, there are no clear bullish or bearish signals, reinforcing the sideways trend observed at shorter intervals.
- The 1-day perspective aligns with the neutral stance of the market, showing little momentum in either direction.
- The 4-hour chart indicates potential consolidation, further supporting a range-bound trading strategy.
For potential entry points based on the analysis of the indicators, traders can look at the following specific levels:
- Buy Entry Point: 0.6750, Take Profit Point: 0.6790, Stop Loss Point: 0.6730.
- Sell Entry Point: 0.6710, Take Profit Point: 0.6670, Stop Loss Point: 0.6730.
With the current market dynamics, the inclination leans slightly towards a Buy scenario, yet traders should approach with caution and be ready to adjust if the market provides clearer signals in the near future.
Risk Disclaimer:
This report contains general market analysis and does not offer investment advice. Forex trading is fraught with potential risks, including the loss of all initial capital and should not be undertaken without thorough assessment and understanding of market conditions and personal risk tolerance. Investors should conduct their own research or consult with an investing professional before deciding to act based on this analysis.