Analyzing the Bearish Tendencies in NZD/USD Market: A Comprehensive Review – 28/03/2025
Tháng 3 27, 2025
Euro vs US Dollar Forex Analysis: Identifying the Bullish Momentum Amid Consolidation – 28/03/2025
Tháng 3 27, 2025Market Overview
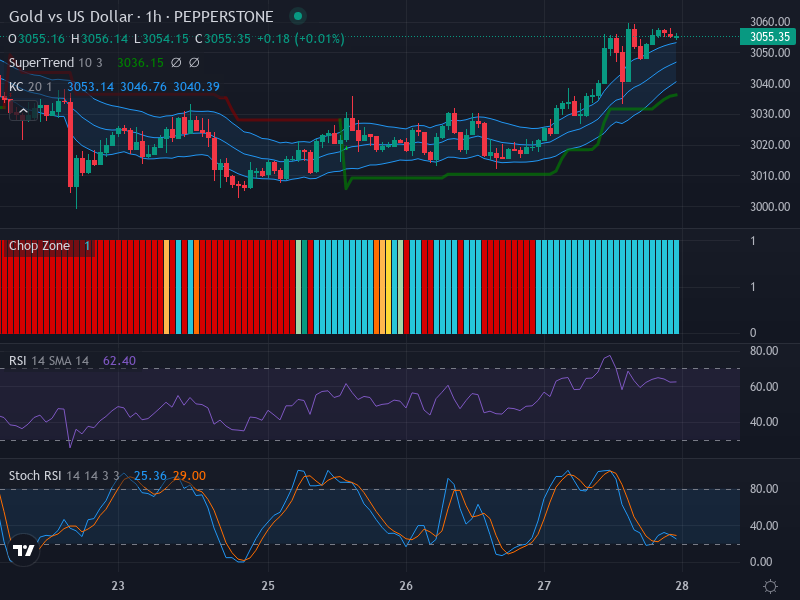
Presently, the Forex market witnesses significantly bullish undertones between Gold and the US Dollar. The currency pair has been riding an upward trend with a consistent succession of bullish candlesticks breaching the Keltner Channel. However, indications of potential short-term corrections are also apparent.
Technical Analysis
From a candlestick pattern interpretation perspective, the noteworthy surge of bullish chart patterns breaking beyond the Keltner Channel symbolizes a robust upward trend. This strong trend could drive the price further above 3055 if the progression remains unchanged. However, a possible retracement might draw the value towards the middle Keltner Channel, approximately around 3040.
Within the RSI (Relative Strength Index) framework, current levels point to neutral to slightly overbought conditions with a reading of 62.40. A testament to the ongoing upward price trajectory, this indicator also sends a word of caution as we inch closer to overbought zones. At this stage, no striking RSI divergences are associated with the prevailing price movement.
An examination of the Stochastic RSI indicates potential adjustments in the short-term. With K = 25.36 and D = 29.00, a crossover of K under D might suggest the likelihood of minor correction or consolidation. This finding aligns with the existing RSI narrative, nudging investors towards caution despite evident upward momentum.
When analyzing across multiple time frames, an important aspect of comprehensive market analysis, the 1-week, 1-day, and 4-hourly charts share a largely similar story. The 1-week time frame witnesses an overall uptrend with potential for further expansion. On the 1-day chart, we observe a steady upward trend, nearing resistance levels with potential consolidation in the near future. Finally, the 4-hour chart points to a bullish continuation, sprinkled with minor corrections which demonstrate strength.
Conclusion and Trading Recommendations
Although the upward drive of gold against the US dollar continues, it’s vital to proceed with slight caution given the overbought signals and potential short-term corrections. Buyers could consider an entry point at 3057, setting a take-profit target around the 3070 mark.
In summation, here is a concise analysis of the trends across different time frames:
- The 1-week time frame shows a strong overall uptrend with possible further bullish movement.
- The 1-day chart is also trending upwards but nearing key resistance, hinting at potential consolidation.
- The 4-hour chart indicates continued bullish momentum, albeit interspersed with minor corrections.
Potential entry points based on a comprehensive analysis of indicators and tools suggest the following:
- Buy Entry Point: 3057, Take Profit Point: 3070, Stop Loss Point: 3045.
- Sell Entry Point: 3040, Take Profit Point: 3025, Stop Loss Point: 3050.
Considering the analysis, a Buy scenario appears more likely, with favorable upward momentum, yet careful monitoring of the market’s movement is crucial given the warning signs of overbought conditions.
Risk Disclaimer
This analysis is based on technical indicators and chart patterns, and it does not consider external factors such as economic events, geopolitical tensions, or fiscal policy changes. Trading in currencies involves significant risks, including the risk of loss of all capital. Please ensure that you fully understand these risks before trading and seek advice from an independent financial advisor if necessary.