
GBP/USD Analysis: Bullish Momentum with Potential for Pullback – 14/04/2025
Tháng 4 13, 2025Navigating Trade Tensions: Japan’s Diplomatic Strategy Under Prime Minister Shigeru Ishiba
Tháng 4 14, 2025Market Overview
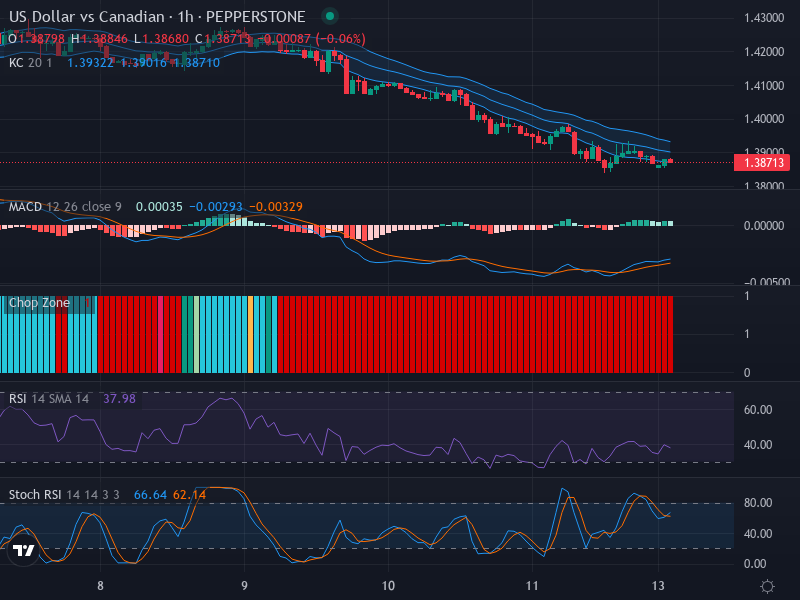
The performance of the currency pair United States Dollar vs Canadian Dollar (USD/CAD) over recent periods indicates an existing downward trend. This trend is evidently represented by a visible series of lower highs and lower lows viewed over a 1-hour timeframe. The market, however, seems to be expressing a certain level of indecision, demonstrated by the presence of numerous small-bodied candles. Meanwhile, a possible retracement zone, as indicated by the last swing high, settles around 1.3930.
Technical Analysis
From a technical point of view, the Relative Strength Index (RSI) currently reads at 37.98, with its slope parallel to the bearish direction of the market. However, the number nearing 30, the conventional oversold threshold, is strongly suggestive of minimal downside potential.
The Stochastic RSI provides a somewhat paradoxical input to the bearish narrative. The K line, presently standing at 66.64, has recently crossed over the D line recorded at 62.14. This upwards crossover, hinting at a potential bull rally, opposes the already established bearish outlook.
Further insight comes from the Moving Average Convergence Divergence (MACD) analysis. The MACD line, which is marginally positive, is surpassed by its counterpart, the Signal line, that is recorded at a negative value. This bearish crossover accurately supports the existing downtrend. However, the histogram, even though it stays below the zero level, is gradually ascending, consequently reducing bearish momentum.
Although not fully addressed, the Keltner Channel and Chop Zone assume significance in predicting future price movements based on the measure of volatility and market noise, respectively.
Conclusion and Trading Recommendations
Aligning with the dominant bearish trend in the market, the recommendation would lean towards selling the USD/CAD pair. The near oversold RSI conditions, however, suggest a possible reversal ahead. Traders must hence be poised for a potential switch and should keep a watchful eye on resistance around the 1.3930 level—a potential retracement zone. It is important to note the contradicting signal from the Stochastic RSI, indicating a potential upward movement and treat this as a caution.
Here’s a concise analysis for different time frames:
- 1-week timeframe: The trend remains bearish with a consistent pattern of lower closing prices, suggesting continued weakness in USD versus CAD.
- 1-day timeframe: Recent movements indicate potential consolidation, but prevailing bearish indicators prevail.
- 4-hour timeframe: A series of lower highs reinforces the bearish sentiment, although an upward correction could come into play soon.
Considering all the analysis above:
- Buy Entry Point: 1.3930, Take Profit Point: 1.3980, Stop Loss Point: 1.3900.
- Sell Entry Point: 1.3860, Take Profit Point: 1.3800, Stop Loss Point: 1.3920.
Taking all indicators into account, a Sell scenario appears more likely given the persisting bearish trend despite potential upward corrections.


