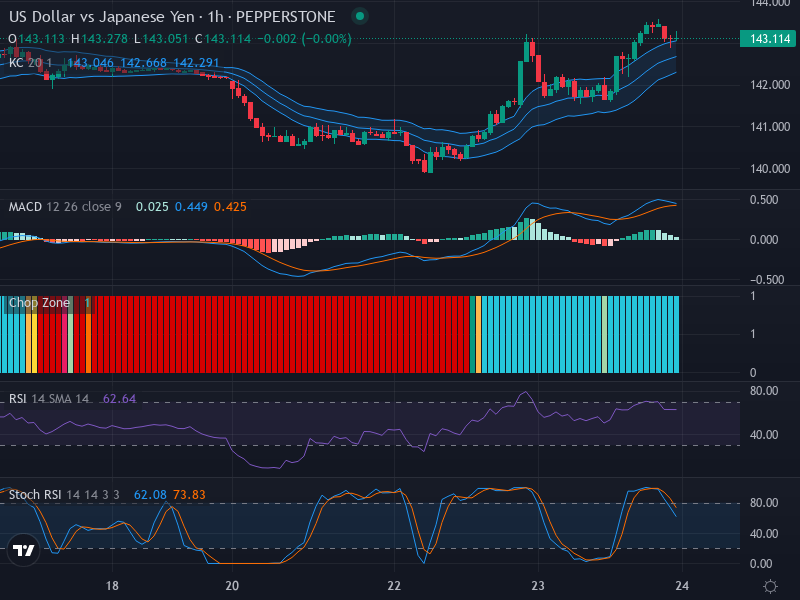
USD/JPY Forex Analysis: Near-term Consolidation Amid Flattish Indicators – 14/04/2025
Tháng 4 13, 2025
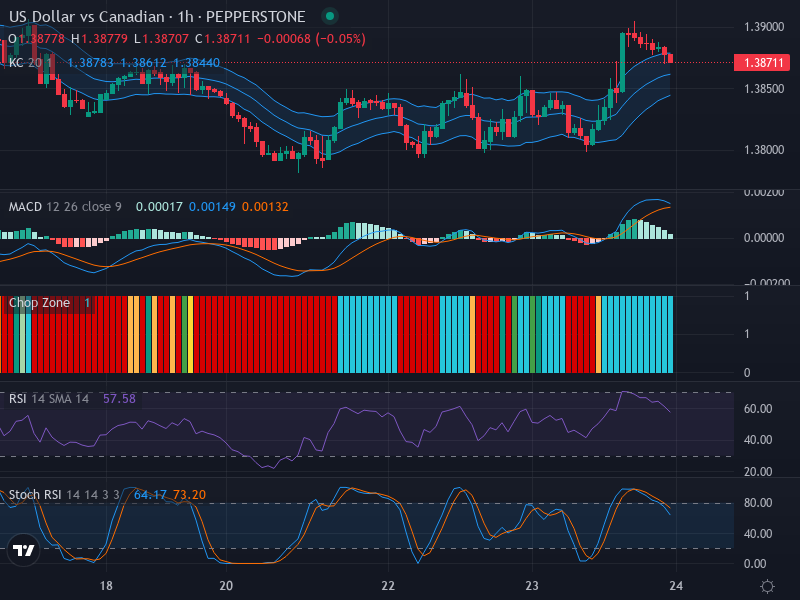
Bearish Outlook on USD/CAD Forex Pair Amidst Contradictory Market Indicators – 14/04/2025
Tháng 4 13, 2025Market Overview
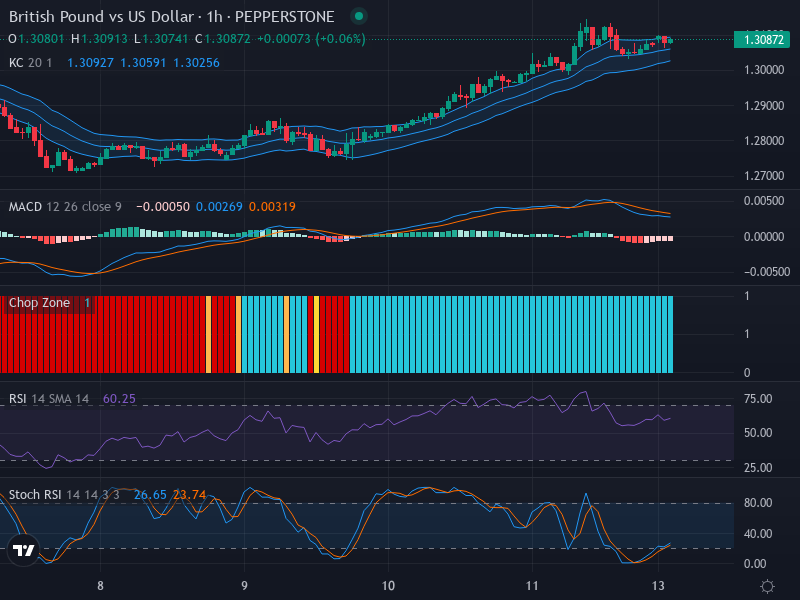
Following a period of sustained increase, the GBP/USD currency pair exhibits continuing signs of an upward trend. The pair has demonstrated a series of higher highs and higher lows, signaling persistent bullish sentiment despite looming indicators of potential retracement. With the current pair price at 1.30872, this report delves deep into the technical indicators to offer a comprehensive analysis of the potential market moves within the context of the observed trend.
Technical Analysis
The primary examination revolves around the currency pair’s candlestick pattern interpretation which confirms our earlier perception of its upward movement. The recent series of small-bodied candles could be interpreted as market indecision or a slight stall in the buying momentum. This uncertainty suggests that the pair may be gearing up for a period of consolidation.
Turning our attention towards the Potential Zones, the middle Keltner Channel Band at 1.30591 stands out as a significant pullback zone. Depending on the evolving price action around this level, it could serve as a solid springboard for sustained buying activity, thereby bolstering the ongoing upward trend.
The Relative Strength Index (RSI), presently valued at 60.25, rests in the neutral zone yet ventures near the overbought territory. While this circumstance underscores the possible continuation of upward momentum, it also brings to light the potential for consolidation in the near term.
Our analysis of the market’s momentum is further supplemented by a look at the Stochastic RSI. A recent crossover of the K line, valued at 26.65, over the D line (23.74), signals potential bullish momentum. Albeit, a point of caution is issued as the pair has also extended into the oversold territory — indicating the possibility of a trading pullback.
Lastly, the Moving Average Convergence Divergence (MACD) Analysis provides nuanced insights. The close positioning of the MACD Line to the Signal Cross reveals potential consolidation or an impending crossover. The histogram illustrates a slightly positive trend, indicating traders’ support for continued bullishness on the pair.
Conclusion and Trading Recommendations
In conclusion, the GBP/USD pair exhibits robust indications of sustained upward momentum as reinforced by various technical indicators. However, it is essential to recognize that minor consolidation signals and the chance of a possible pullback suggest caution. Traders could capitalize on potential upside opportunities around critical support levels.
For the various time frames:
- The 1-week trend shows a strong bullish outlook with recent higher highs and higher lows indicating continued upward momentum.
- The 1-day analysis suggests a temporary stall, indicating possible consolidation around current levels, as seen in the recent candlestick patterns.
- The 4-hour chart reflects indecision in the market with small-bodied candles, further reinforcing the potential for short-term consolidation.
Potential entry points based on these analyses at the 1-hour time frame could be reviewed as follows:
- Buy entry point: 1.30600, Take profit point: 1.31200, Stop loss point: 1.30450.
- Sell entry point: 1.31200, Take profit point: 1.30600, Stop loss point: 1.31350.
Given the current analytical landscape, a Buy scenario appears more likely, particularly if support holds around the 1.30591 level. Additionally, traders should remain vigilant for signs of resistance which may suggest a shift in momentum.