
Comprehensive Forex Analysis: Examining the Euro vs US Dollar Trend on the 1-hour Chart – 14/04/2025
Tháng 4 13, 2025
GBP/USD Analysis: Bullish Momentum with Potential for Pullback – 14/04/2025
Tháng 4 13, 2025Market Overview
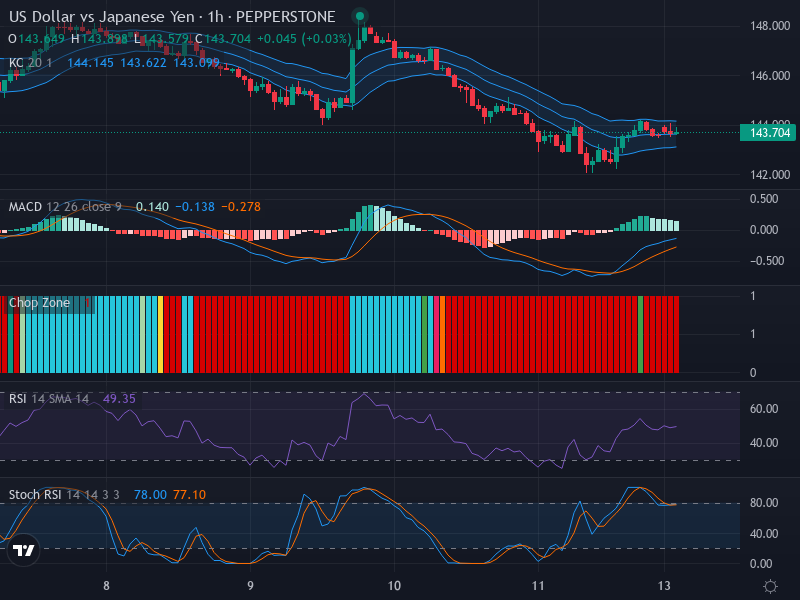
The USD/JPY currency pair finds itself in a phase of horizontal movement following a previous downward trend. This pattern has been persistent, as confirmed by the price action around key resistance and support levels. The recent dynamics indicate a degree of cautiousness among market participants, which might add to the neutral stance in the near term.
Technical Analysis
From a candlestick pattern perspective, the USD/JPY pair has entered a phase of consolidation. The critical resistance level for the currency pair can be spied near 144.000, while the significant support level has solidified around 143.000. These levels are expected to play a crucial role in the pair’s short-term directional bias.
The Relative Strength Index (RSI), currently standing at 49.35, does not signal an overbought or oversold market condition, further corroborating the pair’s neutral trend. The lack of any visible divergence between price action and the RSI suggests a potential continuation of the existing trend, barring the development of any new market-driving momentum.
The use of Keltner Channels and the Chop Zone indicators reveal additional aspects of the ongoing market behavior. The USD/JPY forex pair is currently trading close to the central band of the Keltner Channels. The non-expanded nature of the channels, coupled with the existence of red bars in the Chop Zone, hints towards a prevailing low volatility environment and a confirmation of the market’s sideways movement.
Furthermore, the examination of the Stochastic RSI reveals that the K (78.00) and D (77.10) lines are hovering in the overbought territory. This points towards a possible exhaustion of the upward momentum, which may signal potential pullbacks moving forward.
Conclusion and Trading Recommendations
Based on the discussed technical indicators, the USD/JPY pair appears to be locked in a consolidation pattern. This favors a ‘wait-and-see’ approach on this pair until new momentum surfaces.
Traders should stack their attention towards the critical resistance and support levels (144.000 and 143.000, respectively), as any significant move beyond these thresholds can indeed provide fresh directional cues. It would be prudent to tread with caution, considering the overbought condition reflected by Stochastic RSI, which may potentially bring about price retracements.
Trend Analysis:
- The 1-week time frame shows that the pair is in a prolonged consolidation, indicating a stable but unexciting trend.
- The 1-day time frame aligns with the 1-week analysis, as the price hovers around resistance and support levels, suggesting potential indecision.
- The 4-hour time frame indicates a more reactionary approach, slowly trending towards the upper resistance, but also flirting with potential retracement patterns.
From the analysis above, potential entry points can be summarized as follows:
- Buy Entry Point at 143.500, Take Profit Point at 144.200, Stop Loss Point at 143.200. This scenario can be triggered if price shows resilience close to support.
- Sell Entry Point at 143.900, Take Profit Point at 143.200, Stop Loss Point at 144.200. This would be viable if resistance holds firm and price fails to break above.
In conclusion, while both scenarios present potential opportunities, the Buy scenario is favored slightly more, given the proximity to support and the current market conditions that hint at price stabilization.


