
New Zealand’s Economic Landscape March 2025: Growth Challenges in Manufacturing and Services
Tháng 4 13, 2025
USD/JPY Forex Analysis: Near-term Consolidation Amid Flattish Indicators – 14/04/2025
Tháng 4 13, 2025Market Overview
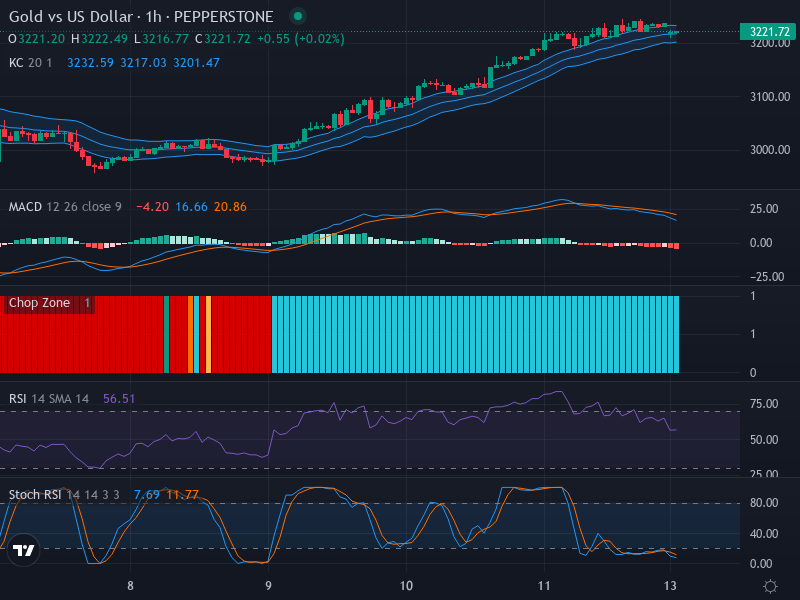
The Gold versus US Dollar pair currently exhibits an upward trend that demonstrates sustained buying pressure. Furthermore, the price of 3221.72 highlights this consistent bullish trend with prospects for further upward momentum. If the ongoing trend persists, attention should be cast on the potential resistance around the 3230 mark or possible retracements to the support level of 3210.
Technical Analysis
The current state of the market, highlighted by a predominant presence of bullish candlestick formations, points to persistent market growth. Higher highs, in line with these bullish candle formations, provide clear signs of increased buying pressure.
The Relative Strength Index (RSI) sits at a neutral position of 56.51, which neither denotes the market as overbought nor oversold. The RSI neutrality reinforces the ongoing upward trend, suggesting the market is poised for sustained upward movement without any immediate reversal signals.
Furthermore, the Keltner Channel Indicator indicates that the price is above its middle band, suggesting a strong long-term uptrend. The expanding channel indicates increased market volatility, placing further emphasis on the bullish momentum. The Chop Zone‘s blue bars, which have shown continuous presence, further indicate a steady trend instead of any sideways movement.
In contrast, the immediate-term perspective, as demonstrated by the Stochastic RSI, suggests potential oversold conditions. The K and D values, 7.69 and 11.77 respectively, sit below the 20 level. Despite this short-term divergence, there is no signal of a trend reversal as there are currently no crossover indications.
The MACD analysis aligns with the main bullish trend. With the MACD line sitting comfortably above the signal line and the MACD Histogram showing positive values, there is further confirmation of the prevalent bullish sentiment.
Conclusion and Trading Recommendations
The Gold vs US Dollar pair presents a bullish market view, with an upward trend supported by various technical indicators. In terms of immediate trading recommendations, traders may consider ‘Buy’ positions, focusing on potential price surges around the 3230 mark. However, should there be a retracement, the 3210 support level would serve as a significant point of interest.
Analyzing the 1-week, 1-day, and 4-hour time frames, the trends are as follows:
- The 1-week trend shows a strong bullish direction, with consistent higher highs suggesting continued market strength.
- The 1-day time frame confirms this bullish sentiment, backed by strong support levels that uphold the upward trajectory.
- The 4-hour view illustrates short-term bullish movements, although minor fluctuations could present temporary adjustments within the upward trend.
Based on this comprehensive analysis, potential entry points can be established at the 1-hour timeframe. Traders might consider the following specific entry and exit points:
- Buy Entry Point: 3225, Take Profit Point: 3240, Stop Loss Point: 3215.
- Sell Entry Point: 3215, Take Profit Point: 3200, Stop Loss Point: 3220.
In conclusion, a Buy scenario appears more likely given the prevailing market indicators and the overall bullish sentiment. As always, traders should maintain diligent risk management practices to safeguard their capital.


