
Historic Surge in U.S. 30-Year Treasury Yields: Key Insights and Implications
Tháng 4 11, 2025Unprecedented Surge: 30-Year U.S. Treasury Bond Yields Rise to 4.95% – What It Means for Investors
Tháng 4 11, 2025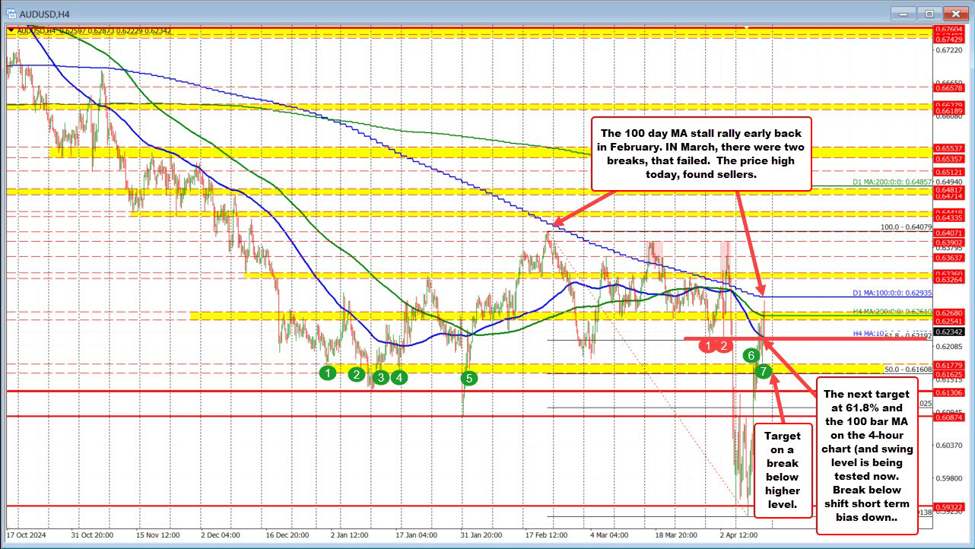
Analyzing the Recent Developments in the AUD/USD Currency Pair
The AUD/USD currency pair, which represents the exchange rate between the Australian dollar and the US dollar, has been the focus of recent market analyses, revealing intricate dynamics shaped by Elliott Wave patterns, technical resistance and support levels, and moving averages. Understanding these components is vital for traders looking to navigate this volatile market.
Elliott Wave Analysis: A Complex Scenario
Current Elliott Wave analysis of the AUD/USD daily chart depicts a counter-trend scenario that is unfolding within an impulsive wave structure. Specifically, wave C has been identified as active and represents a segment of a larger corrective wave, denoted as gray wave Y. This development follows the completion of navy blue wave B, indicating that the market action is now moving through wave C. A critical threshold for this scenario has been established at 0.63933, serving as the invalidation level. On a more micro scale, the 4-hour chart highlights a focus on the completion of orange wave 2, suggesting that traders should remain vigilant for a potential surge as orange wave 3 could emerge next.
This intricate wave structure implies a complex trading environment, requiring traders to adopt a meticulous approach. Those familiar with Elliott Wave theory will understand that such developments can lead to significant price movements in response to market sentiment and other external factors. For more insights on how to navigate similar trading complexities, you can refer to this article on investment mistakes to avoid.
Technical Resistance and Support Levels
In assessing the technical landscape, significant resistance for the Australian dollar is currently located at the 0.62 mark, a level that was previously recognized as support but has now shifted roles. This transition has been affected by ongoing US-China trade tensions and the recent performance of the US dollar, which continues to exhibit weakness. Traders should note that a breakout above 0.6275 could catalyze a broader trend toward USD weakness, encouraging upward movement in the AUD/USD currency pair. Conversely, a decline below the 0.60 level could signify increased bearish sentiment.
Understanding these support and resistance levels is crucial for executing informed trading strategies. Awareness of potential breakout scenarios can provide opportunistic entry points for traders and allow them to hedge against downside risks effectively. For key investment mistakes to avoid while trading, check out this piece on investment mistakes to avoid in 2023.
The Role of the 100-Day Moving Average
Moreover, the behavior of the 100-day Moving Average (MA) adds another layer of complexity to the AUD/USD pair’s current technical picture. The ongoing price action tests the support offered by the 100-day MA, a dynamic that can significantly affect short-term trading decisions. As traders evaluate potential volatility in the AUD/USD pair, the absence of explicit details regarding current price movement near the 100-day MA underscores the need for close monitoring of market trends.
Conclusion: Navigating the Bearish Outlook
In summary, the AUD/USD currency pair finds itself entwined in a multifaceted web of technical indicators, including Elliott Wave patterns, shifting resistance and support levels, and the influence of moving averages. Such dynamics suggest a potentially bearish near-term outlook for the pair, driven by a combination of technical factors and external economic influences. As traders engage with this complex market, a comprehensive understanding of these elements will be essential for crafting successful trading strategies and mitigating risks.
By closely monitoring the developments surrounding the AUD/USD, market participants can stay ahead of the curve and make informed decisions in this volatile foreign exchange landscape. For a broad overview of the impact of international trade on market dynamics, you might find the analysis of strategic moves by China insightful.