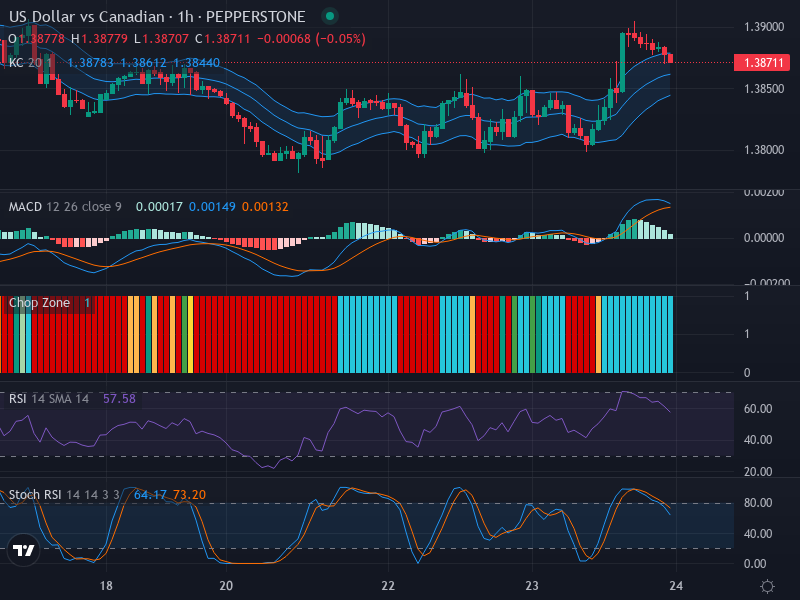
US Dollar vs Canadian Dollar: Bullish Signals Building up Amid Slightly Rising Momentum – 27/03/2025
Tháng 3 27, 2025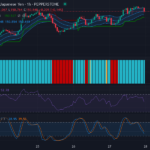
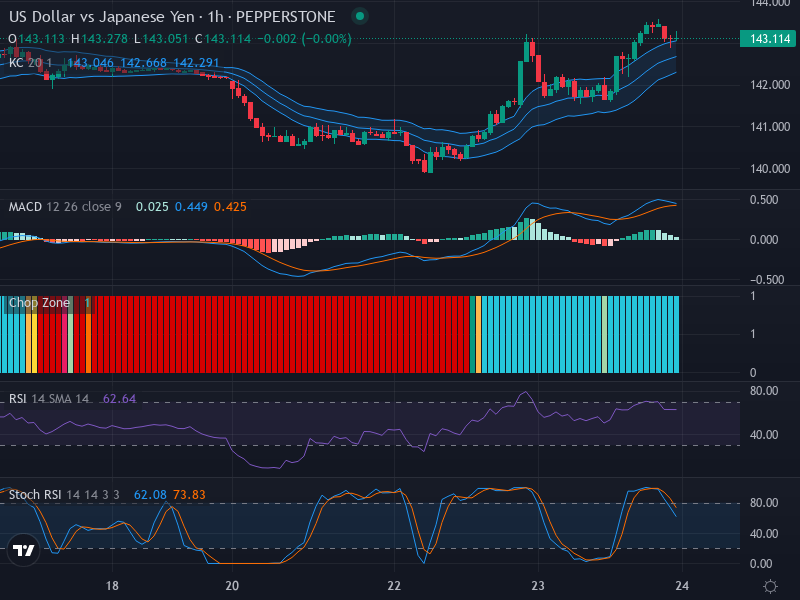
Upward Bias Evident in USD/JPY Amidst Sideways Market Movement – 28/03/2025
Tháng 3 27, 2025Market Overview
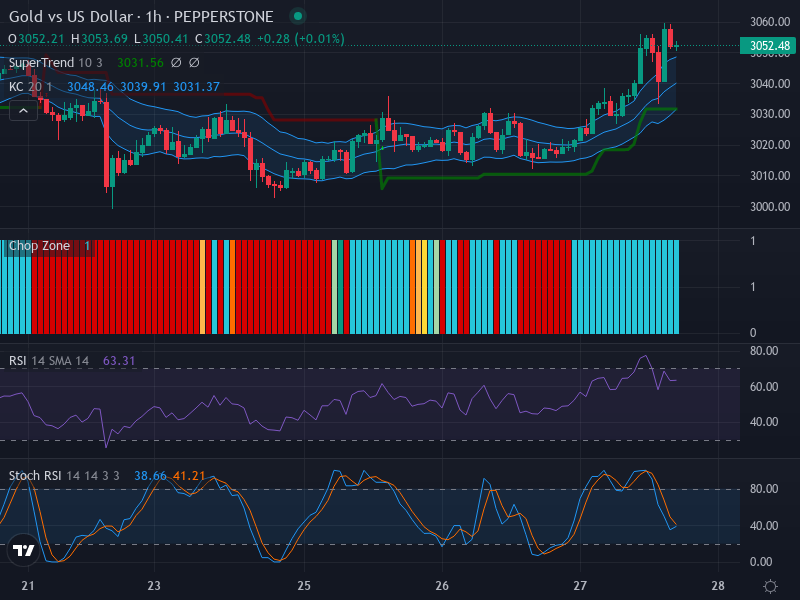
In the world of foreign exchange trading, the Gold vs US Dollar pair is under sharp microscope. The market is currently revealing a significant uptrend, albeit with a recent minor pullback. From a broader perspective, the upward move is still in play, with upcoming potential resistance levels likely to test the bulls’ stamina.
Technical Analysis
Candlestick patterns indicate a prospective bullish continuation trend. Yet, it’s worth highlighting the resistance that the market is wrestling with at the present level. Concerning price zones, a potential retracement near 3030 cannot be shrugged off, and a resistance hurdle is looming around the 3060 mark.
An examination of the Relative Strength Index (RSI) reflects a cautious approach for traders. With an RSI value of 63.31, the market is seen swerving towards an overbought status, although it is presently neutral. The RSI trend suggests a minor upward movement, which slightly deviates from the recent price surge, signaling a noteworthy divergence.
Involving Keltner Channels and the Chop Zone indicators reveals illuminating insights. Prices floating above the middle band of the Keltner Channels specify an upward trend. Meanwhile, the expansion of the channel manifests an increased market volatility. As per the Chop Zone, the fluctuating colors suggest a short period of consolidation, albeit the general trend remains bullish.
The Stochastic RSI (Stoch RSI), however, presents a different view. With the K line at 38.66 and the D line at 41.21, the signal for a potential minor bearish pullback is flagged as the K line crosses below the D line. This short-term downward pressure contrasts the present upward price momentum, hence a cautionary tale for traders.
Conclusion and Trading Recommendations
Concluding our analysis, the 1-week time frame endorses an upward trend with moderate bullish momentum. The 1-day time frame reveals a robust upward trajectory encountering impending resistance, while the 4-hour time frame echoes the continuation of the upward movement.
Based on the comprehensive analysis, traders may consider long positions, awaiting breakouts toward the mapped resistance levels. However, the short-term bearish pressure illustrated through the Stoch RSI advocates for meticulous stop-loss placement and position sizing.
Trading Recommendations for Buy and Sell Scenarios
- Buy Scenario: Entry point at 3055, take profit at 3085, stop loss at 3030.
- Sell Scenario: Entry point at 3025, take profit at 3000, stop loss at 3050.
Risk Disclaimer
The above analysis is based on technical indicators and chart patterns. Traders are reminded that foreign exchange trading involves considerable risk that may result in substantial financial losses. It’s recommended to consider all market elements and individual risk tolerance before making trading decisions. The provided analysis should not be considered financial advice, but a facilitator of informed trading decisions.