Navigating the Waters: A Detailed Analysis of the NZD/USD Pair’s Consolidate and Surge – 27/03/2025
Tháng 3 27, 2025
Gold vs US Dollar: A Comprehensive Technical Analysis Amid Potential Bullish Continuation – 27/03/2025
Tháng 3 27, 2025Market Overview
In the Forex market, the US Dollar (USD) against the Canadian Dollar (CAD) seems to be indicating potential short-term upward momentum, signaling an end to the pair’s recent downward trend. In brief, the market’s general trend is hinting at a possible shift from a prevailing bearish outlook to an emerging bullish perspective. This transition underscores the importance of monitoring the pair closely with an eye on identifying possible investment opportunities.
Technical Analysis
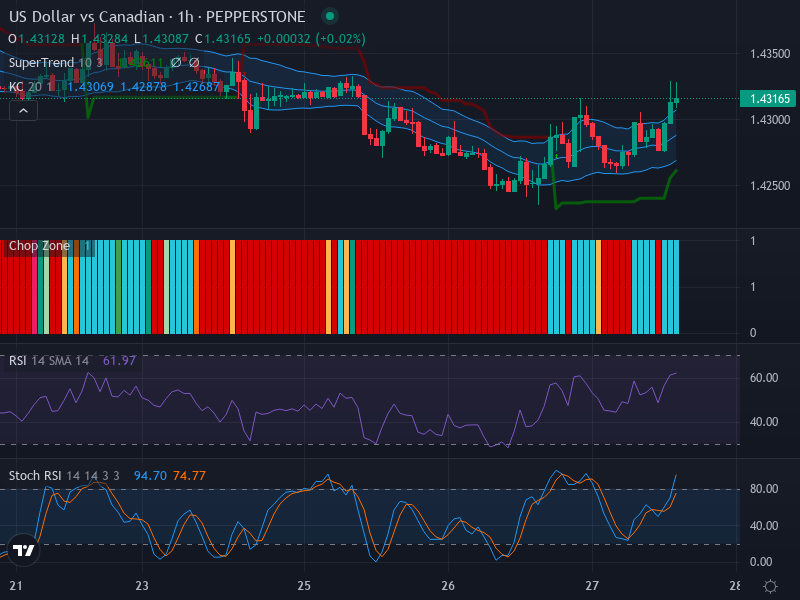
Firstly, an examination of recent candlestick patterns points to bullish sentiments, as prominently noted by bullish engulfing formations spotted around the current position. This signals a potential buildup in buying pressure, which could propel the currency pair into the upper trend area. Alongside this, the market’s general direction seems to be transitioning from a downturn to a sideways trend, an essential precursor to upward momentum.
On the levels front, we’re identifying resistance close to 1.43500. Meanwhile, noted support exists in the vicinity of 1.42600, which could serve as a profound retracement battlefield in case of downward price action.
The Relative Strength Index (RSI) registers a value of around 61.97, a neutral to slightly bullish classification. The RSI nears the edge of overbought territory, suggesting the potential for continued upward momentum, provided the index approaches the overbought 70-mark threshold without intense pullback.
Turning to Keltner Channels, the price movement is notably heading towards the upper band, indicative of a potential bullish trend. Moreover, the increasing channel expansion reveals signs of amplified volatility, implying potentially larger price swings, hence increased opportunities for traders.
Moreover, the Chop Zone’s red bars mark a previously sideways market, which could soon experience neutral breakouts considering the prevailing momentum.
The Stochastic RSI (Stoch RSI) has a K line value of 94.70 and a D line value of 74.77 – with the K line striding above its counterpart. That signals the possibility of rising bullish momentum. Nevertheless, we should exercise caution given the nearing overbought levels.
Conclusion and Trading Recommendations
Considering the emerging bullish signs, potential traders could lean towards more buying-oriented strategies for the US Dollar/Canadian Dollar pair. However, keep a keen eye on the identified support and resistance levels, as they could present significant price action zones.
With the 1-week trend indicating a downturn with a possible bottom formation, the 1-day trend showing sideways movement with increasing potential for bullish behavior, the market presents interesting dynamics.
- In the 1-week time frame, the trend indicates a struggle to maintain lower levels with a potential bottom forming, which could signal a shift toward recovery.
- In the 1-day time frame, we observe a sideways trend with bullish signals emerging, suggesting possible upward movement.
- The 4-hour time frame presents increasing buying momentum with technical indicators confirming strength in the upward trajectory.
Identifying potential entry points based on the analysis:
- Buy Entry Point: 1.42850, Take Profit Point: 1.43500, Stop Loss Point: 1.42500.
- Sell Entry Point: 1.42600, Take Profit Point: 1.42000, Stop Loss Point: 1.42800.
Risk Disclaimer
Forex trading involves significant risks, and any decision to invest should only be made after carefully considering individual financial circumstances, investment objectives, risk tolerance, and trading expertise. It should be noted that the mentioned analysis and outlook are prepared using technical analysis strategies only, and do not account for fundamental market events or macroeconomic developments. Investors should consider these factors before making investment decisions.