
Gold vs US Dollar: Upward Surge But Overbought Conditions Point To Possible Retracement – 11/04/2025
Tháng 4 10, 2025US Dollar Outlook 2025: Key Trends and Predictions Amidst Economic Uncertainty
Tháng 4 10, 2025Market Overview
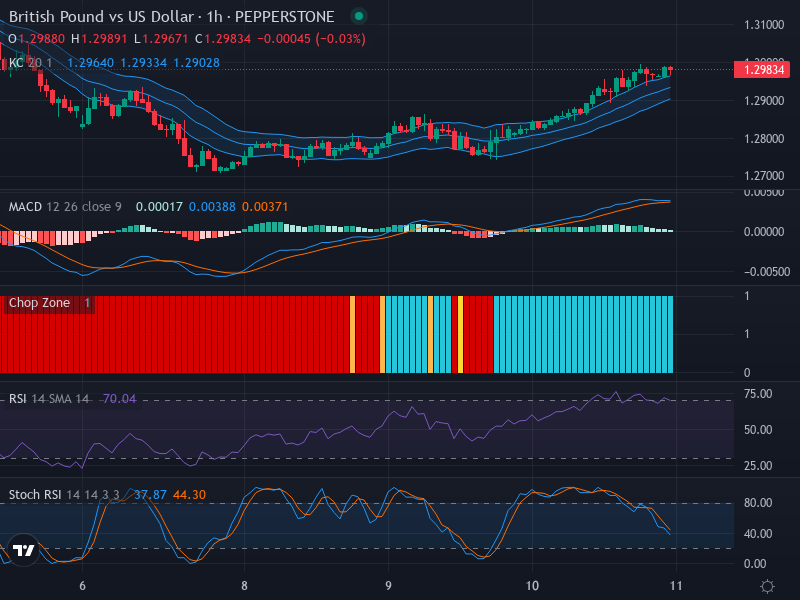
In the Forex space, the GBP/USD pair is demonstrating an upward direction with an immediate resistance seen at around 1.300. Currently, it holds its position at 1.2984. A cross-examination of the candlestick pattern reinforces this observation with recent bullish formations suggesting a growing market sentiment for the pair. Pull-backs, highlighted by a consequential support level at 1.290, may be seen in the short term.
Technical Analysis
Analyzing the GBP/USD pair via the candlestick pattern, an upward trajectory is perceivable, with current bullish formations supporting this inclination. Also, immediate resistance and support are noted at 1.300 and 1.290 respectively. These points present crucial zones for potential retracement should the pair’s price fail to break through the resistance and gets pulled back to the support.
The Relative Strength Index (RSI), currently at 70.04, offers additional clarification to the price behavior. As it straddles the overbought threshold, it confirms the upward trend documented in the candlestick analysis. However, this also serves as a warning of potential retracement since overbought conditions often precede price corrections.
The Stochastic RSI further adds weight to the prediction of a probable short-term bearish correction. The observed crossover of the K-line (37.87) below the D-line (44.30) indicates a retreat from an overbought market state, suggesting room for a downward turn in the market’s momentum.
As a final element in our technical evaluation, the Moving Average Convergence Divergence (MACD) offers insights into the market’s sentiment. With the MACD line (0.00017) above the Signal line (0.00038), a bullish undertone is suggested. This is reinforced by the rising bars of the MACD histogram, which align with the ascending price trends, uniquely confirming the forecasts made by our other analytic methods.
Conclusion and Trading Recommendations
The current analysis conveys a multifaceted picture of the GBP/USD pair. With an established upward trend backed by candlestick patterns, RSI, and MACD evidence, traders could be ready to engage in long-term buying strategies. However, the possibly imminent retracement due to the overbought conditions and Stochastic RSI indications advocates for caution. Traders should keep a vigilant eye on the 1.300 resistance and 1.290 support lines for any signs of a forthcoming retracement.
Trend Analysis by Time Frames
- In the 1-week time frame, the trend suggests continued bullish momentum, albeit with signs of overextension, indicating the potential for a retracement.
- In the 1-day time frame, the pair shows resilience around the current levels, consistently testing the resistance while maintaining a bullish outlook.
- Within the 4-hour time frame, the indicators conflict slightly. While the trend remains bullish, the conditions are ripe for a short-term bearish correction before resuming upward movement.
Potential Entry Points
- Buy Entry Point: 1.2980, Take Profit: 1.3050, Stop Loss: 1.2950.
- Sell Entry Point: 1.3000, Take Profit: 1.2900, Stop Loss: 1.3020.
We conclude that a Buy scenario is more likely in the medium to long-term, especially if the price consolidates above 1.2980. However, short-term corrections may occur, and traders should be prepared to adapt their strategy accordingly.
Risk Disclaimer
Note that this analysis is provided as a market research tool and does not guarantee any results. Forex trading involves a high degree of risk and may not be suitable for all investors. Always perform personal market research and consult your financial advisor before making trading decisions.


