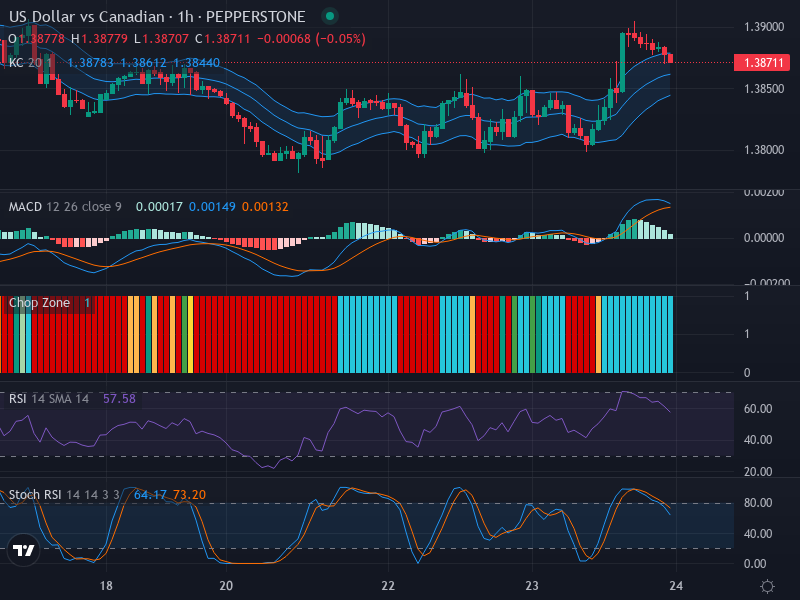
US Dollar vs Canadian Dollar: Examining Trend Shift Amidst Weakening Bearish Momentum – 10/04/2025
Tháng 4 9, 2025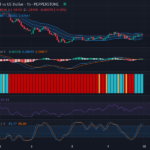
Lateral Movement in Pound versus Dollar: A Close View of GBP/USD’s Forex Chart – 10/04/2025
Tháng 4 9, 2025Market Overview
The Euro against the US Dollar (EUR/USD) is currently demonstrating a sideway trend with a mild downward bias. Although there are no significant bullish engulfing or doji formations, traders are keenly observing certain zones where a rally or retracement might be initiated, making the currency pair a volatile playground for speculators and investors. Let’s delve deeper into the technical aspects that may potentially shape the future movements of EUR/USD.
Technical Analysis
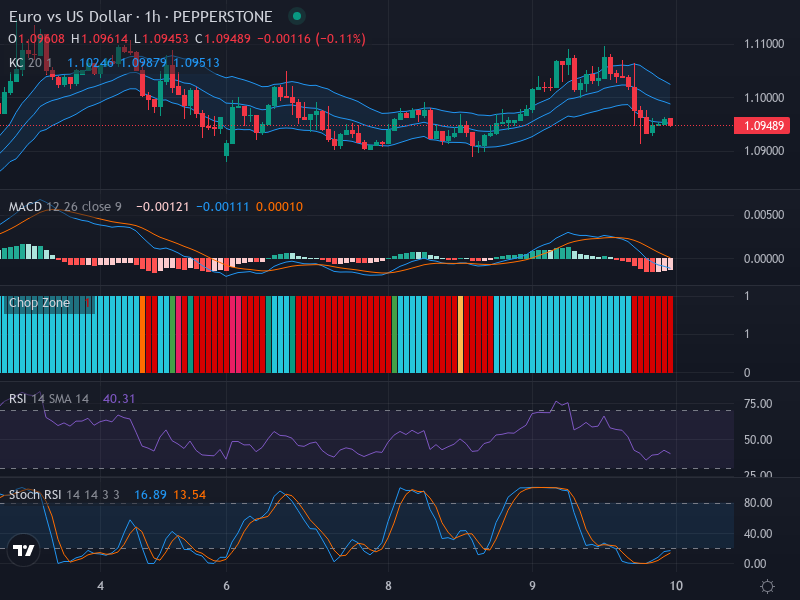
The recent candlestick pattern analysis reveals an absence of distinct formations in the form of bullish engulfing or doji patterns, underscoring a lack of decisive market direction. The price trend, however, leans slightly toward the downward side. Consequently, a crucial resistance level to watch for a potential breakout lies at 1.09513.
In the meantime, our Relative Strength Index (RSI) sits at 40.31, pointing to a neutral to slightly oversold market state. No significant divergence is evident, reinforcing the general market direction suggested by the candlestick charts.
Turning our attention to the Keltner Channels and Chop Zone analysis, the price has been hovering around the middle band of the EMA 20, further substantiating the sideways trend. Notably, the Chop Zone has been manifesting continuous colored bars, corroborating the lateral movement and the price’s propensity to stay within a confined range.
Simultaneously, levels of volatility remain subdued as Keltner Channels are showing relatively tight patterns, indicating a low-volatility environment at least in the short-term.
The Stochastic RSI reveals that the K line (16.89) has crossed above the D line (13.54) recently, highlighting potential upward pressure. Despite the general downward inclination, this signal suggests a possible trend reversal.
Lastly, the Moving Average Convergence Divergence (MACD) has yet to reveal any substantial directional hints in the available analysis.
Conclusion and Trading Recommendations
While the overall market sentiment for EUR/USD seems slightly bearish, it currently leans heavily towards sideways movement with a potential for a breakout in either direction. The slight oversold condition indicated by RSI, coupled with a recent bullish crossover in the Stochastic RSI, could point towards a short-term uptrend, increasing the speculative appeal of the currency pair.
However, traders should remain wary of sudden price changes as the MACD could provide a decisive outlook soon. Until then, it may be beneficial for investors to practice a wait-and-see approach until more explicit signals materialize.
Trend Analysis Across Time Frames
- 1-Week Trend: The long-term trend appears to be stabilizing, but the lack of strong directional movement indicates that traders should be cautious about entering large positions without clear signals.
- 1-Day Trend: The daily trend shows potential for upward movement but remains in a narrow trading range. This could signify underlying indecision among market participants.
- 4-Hour Trend: The 4-hour analysis reflects a slight tilt towards downward momentum, underscoring the need for careful monitoring of key resistance and support levels.
Potential Entry Points
Considering the above analysis:
- Buy Entry Point: 1.09200, Take Profit Point: 1.09800, Stop Loss Point: 1.08900
- Sell Entry Point: 1.09500, Take Profit Point: 1.09000, Stop Loss Point: 1.09750
In conclusion, given the current technical indicators and market sentiment, a Buy scenario seems more likely to manifest in the near term as traders may seek to capitalize on the short-term upward potential while acknowledging the possibility of triggering sell-off orders at established resistance levels.