
Sideways Trend in USD/CAD Pair Promises Potential Price Surge: A Detailed Analysis – 09/04/2025
Tháng 4 9, 2025
Shocking Poll Reveals Left-Leaning Americans’ Disturbing Views on Political Violence
Tháng 4 9, 2025Market Overview
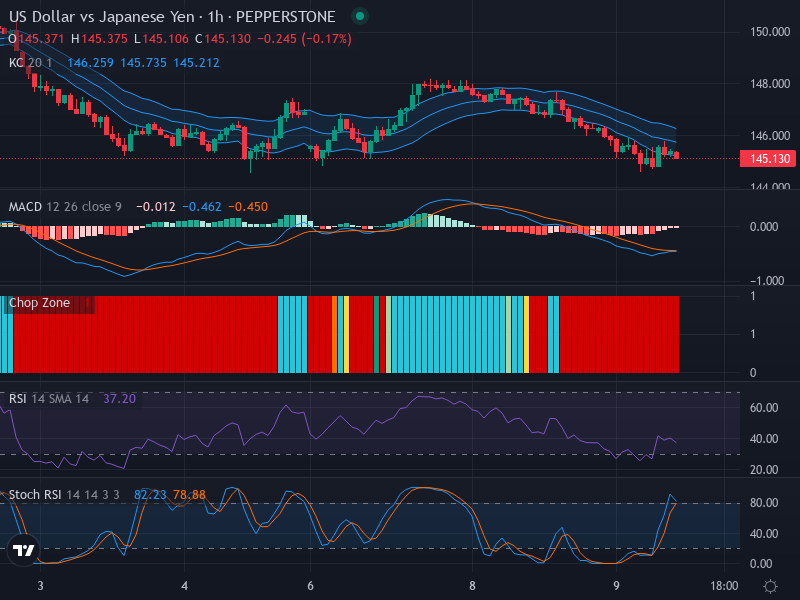
The Forex market has recently seen an intensification in the bearish trend of the US Dollar against the Japanese Yen (USD/JPY), with increased volatility. Prices are moving below the middle band of the Keltner Channels, affirming the downward market direction with no apparent distinct reversal candlesticks.
Technical Analysis
The interpretable Candlestick Pattern of the current USD/JPY chart highlights a downward market direction. This further solidifies with an absence of any immediate reversal candlesticks. The lack of patterns such as hammers or bullish engulfing signs points towards the lingering bearish sentiment.
The Keltner channels provide significant insight into the currency pairs’ trend and volatility. The channel midpoint is denoted by EMA 20 (Exponential Moving Average), which is currently under the pressure of the price. This is an explicit bearish indication. Additionally, the channel’s moderate expansion signifies increased market volatility. This behavior informs us about the market participants’ unperturbed bearish bias.
In the case of the Relative Strength Index (RSI), the value remains in the oversold zone, holding a stance at 37.20. This suggests there might be attractive buying opportunities soon. However, this should be interpreted with caution as there are no clear signs of reversing the trend based on the RSI value and price movements.
The Stochastic RSI (K line: 82.23, D line: 78.88) presents some inconsistency, marking a recent crossover of the K line above the D line, which is a typically bullish reversal sign. However, both lines hover near the overbought level, contradicting the current bearish bias and warranting caution in confirming such reversals.
Furthermore, the Moving Average Convergence Divergence (MACD) analysis echoes the bearish sentiment. With the MACD line (-0.462) below the signal line (-0.450), the suggestion follows a bearish crossover. Additionally, the declining histogram bars fail to indicate any bullish divergence, further buttressing the predominance of bearish sentiment.
Conclusion and Trading Recommendations
Continued caution is warranted while trading USD/JPY considering the ongoing bearish trend. The current indicators appear to contradict each other, with the Stochastic RSI pointing towards a potential reversal, albeit prematurely, and other indicators like the MACD and RSI reaffirming the bearish sentiment. Therefore, traders should wait for clearer signals of a trend reversal or stick with a short-selling strategy until then. Avoiding any significant long positions might be prudent unless otherwise justified by underlying technical or fundamental factors.
Trend Analysis Across Time Frames
In reviewing the trends for USD/JPY across various time frames, the insights are as follows:
1-week trend: Sustained bearish momentum with prices positioned below critical moving averages, reinforcing the downward bias.
1-day trend: Consolidation likely but below important resistance levels, suggesting continued weakness in upward movements.
4-hour trend: Recent price action suggests low volatility with the potential for short-term sell opportunities within current downward trends.
Potential Trading Points
After analyzing the above indicators, here are suggested entry points and expected profit zones for traders:
- Buy Entry Point: 130.50; Take Profit Point: 131.00; Stop Loss Point: 130.20.
- Sell Entry Point: 130.00; Take Profit Point: 129.50; Stop Loss Point: 130.20.
Given the current analysis, a Sell scenario appears to be more likely. The strong bearish indicators outweigh the potential signs of reversal, suggesting traders might find more success in shorting the pair until clearer bullish signals emerge.


