
GBP/USD Forex Market Undergoing Neutral Momentum: A Comprehensive Technical Analysis – 09/04/2025
Tháng 4 9, 2025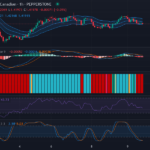
Sideways Trend in USD/CAD Pair Promises Potential Price Surge: A Detailed Analysis – 09/04/2025
Tháng 4 9, 2025Market Overview
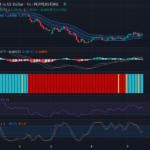
The detailed examination of the Euro vs. US Dollar pair (EUR/USD) reveals a recent bullish momentum. The upward trend seems to be characterized by sporadic pullbacks, providing a dynamic view of the current Forex market context. Notable occasional overflows above the midpoint of the Keltner Channels suggest a bullish tendency that could potentially maintain its pace in the near term.
Technical Analysis
The current currency pair, EUR/USD, is treading an upward trajectory. An interpretation of the evolving candlestick pattern uncovers a robust bullish push, frequently breaching the middle band of the Keltner Channels. This implies that the bullish momentum might be gearing up for a more influential performance in the following trading sessions.
Looking at significant price levels, the expected resistance zone hovers near 1.1100, which might act as a barrier to further appreciation of the Euro. Conversely, the support level, situated near the 1.1000 area, might serve as a potential retracement point or a spot for possible rebounding of the price tag.
The currency pair’s technical situation is further substantiated by the Relative Strength Index (RSI) data, registering a value of 63.01. This reading suggests an existing bullish sentiment, restating the currency pair’s current upward trajectory while remaining below overbought levels.
Despite the bullish scene painted by the aforementioned analysis, the Stochastic RSI (Stoch RSI) bears a slightly different note. With a K Value of 31.88 positioned below the D Value at 33.35, a potential bearish divergence might be in the making, proposing a plausible short-term pullback in the offing.
Complementing the ensemble of indicators is the MACD Analysis, which shows a modestly bullish crossover. The MACD line (0.00039) is only slightly hovering above the signal line (0.00229), corroborating the premise for possible continuation of the upward trajectory – a hypothesis further supported by the weak divergence exhibited by the histogram. However, any sudden change in their relationship could flip the switch on the ongoing momentum.

Conclusion and Trading Recommendations
Overall, the dominant trend on a 1-Week Time Frame appears bullish, with potential testing of the resistance. Yet, in the shorter-term 1-Day Time Frame, consolidation might provide room for a possible pullback prompted by the bearish divergence in the Stoch RSI. As a result, traders should watch for an optimal entry point during this temporary pullback whilst maintaining a bullish bias for the larger time frames.
From our analysis:
- The 1-Week Time Frame shows a strong bullish trend nearing resistance.
- The 1-Day Time Frame indicates a potential pullback due to bearish divergence.
- The 4-Hour Time Frame suggests consolidation, confirming the possibility of a short-term retracement.
Potential entry points based on the analysis suggest considering the following scenarios:
- For a Buy entry point, observe around 1.1010 with a Take Profit level at 1.1080; set the Stop Loss at 1.0990.
- For a Sell entry point, it would be prudent to consider selling near 1.1095 with a Take Profit level set at 1.1050; the Stop Loss could be positioned at 1.1105.
Given the prevailing indicators and market conditions, a Buy scenario seems more likely to occur, especially after any consolidative pullback that could offer optimal entries for robust upward movements.


