

European Stock Indices Show Signs of Recovery Amid U.S.-China Tariff Tensions
Tháng 4 8, 2025
UBS Lowers Eurozone Growth Forecast to 0.5%: Navigating Economic Challenges Ahead
Tháng 4 8, 2025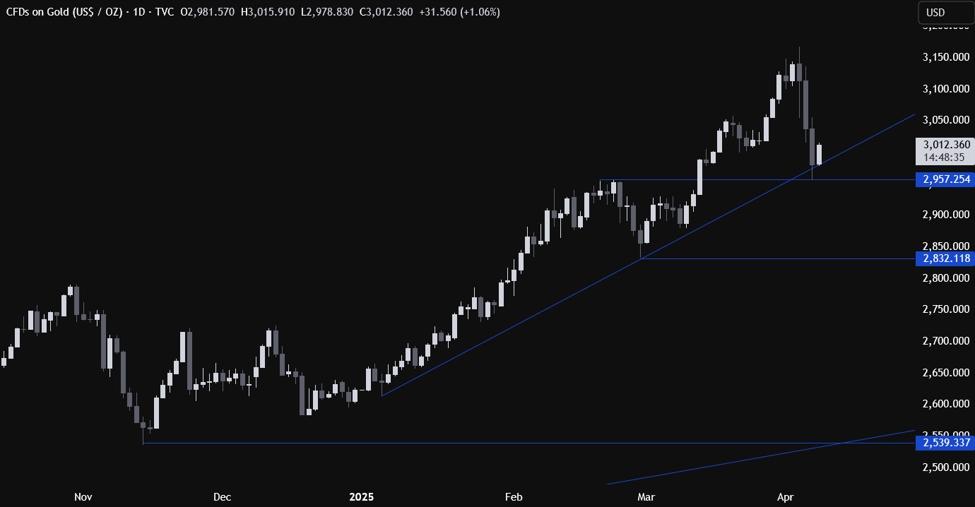
Gold Price Analysis: Navigating Market Volatility and Future Predictions
Gold has long been considered a safe-haven asset, but recent analyses reveal that its price is profoundly influenced by global market volatility. As we delve into the current technical trends and future predictions, it becomes evident that the precious metal is experiencing a dynamic interplay between bearish corrections and bullish prospects.
Recent Trends and Predictions for Gold
Recently, gold prices saw a significant decline, with analysts suggesting a bearish correction that may lead to a testing of the $3000 support level. Prices hovered around critical thresholds, supported by notable levels such as $3000 and $2981. Despite these downward movements, some experts project a potential rebound, with targets set as high as $3100. This is underpinned by robust uptrends observed on both daily and weekly chart analyses, which may indicate a recovery path despite the current correction.
This duality in market sentiment creates a complex picture for investors and traders alike. While short-term movements may indicate bearish tendencies, long-term trends exhibit promising signs for bullish activity. As fluctuating market conditions continue to evolve, the outlook remains uncertain yet hopeful, focusing eyes on the trajectory that gold may take in the coming weeks. For insights into avoiding common investment mistakes that could impact gold investment strategies, check this guide on top investment mistakes to avoid in 2023.
Understanding Technical Indicators and Their Significance
The technical indicators currently employed offer valuable insights into potential future movements for gold prices. Notably, the Elliott Wave Theory plays a crucial role in predicting market behavior, suggesting that gold might undergo a corrective phase. Specifically, analysts have pointed towards an anticipated ABC correction, prompting investors to closely monitor ongoing developments and patterns that could validate this hypothesis.
Furthermore, Fibonacci retracements are becoming increasingly vital in identifying possible resistance and support levels. Analysts using these techniques are targeting a price point of $3275 based on Fibonacci extensions, reflecting growing confidence in potential upward movements should the market stabilize. Fibonacci levels have long established themselves as a fundamental aspect of technical analysis, helping traders make informed decisions driven by historical price patterns. For a deeper understanding of avoiding psychological pitfalls in investment strategies, consider Barry Ritholtz’s insights on investment mistakes to avoid for success.
Support Levels to Watch
Understanding potential support levels becomes indispensable in navigating the fluctuating gold market. Investors are particularly attentive to critical benchmarks around $3000, alongside lower supports that include $2981 and $2900. An insightful observation from Elliott Wave analysis identifies a support level at $2879.98 on the daily chart, emphasizing the importance of these price points in determining market behavior in both bearish and bullish scenarios.
Overall, gold’s price is effectively caught in a tussle between short-term corrections and a generally bullish sentiment fueled by market dynamics and solid technical signals. As investors remain vigilant in their strategies, gaining insight into both imminent bearish corrections and potential bullish recoveries will remain paramount in the unfolding narrative of gold prices. For more on the relevance and strategy of value investing in the current market, check out this discussion on why value investing beats the market. Whether you are a seasoned trader or exploring opportunities in gold investment, staying abreast of these market movements is key to making informed decisions in the ever-evolving realm of precious metals.