
GBP/USD Forex Analysis: Downward Pressure Prevails Despite Faint Bullish Signals – 08/04/2025
Tháng 4 7, 2025
Examining the Bearish Sentiment in the Euro vs US Dollar Forex Market – 08/04/2025
Tháng 4 7, 2025Market Overview
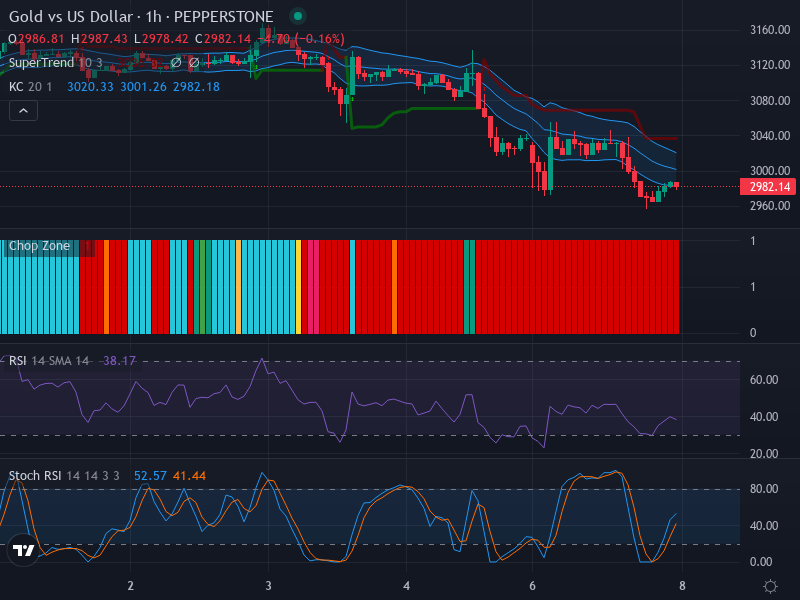
The Gold vs US Dollar (XAU/USD) currency pair is presently exhibiting a captivating dynamic from a technical perspective. The pair is unfolding in a short-term downward trend as per the recent 1-hour chart, yet the overall picture suggests a more tangled condition as multiple indicators propose possible divergent scenarios.
Technical Analysis
Delving into the 1-hour chart, we observe a slew of bearish candlesticks. These bearish candles reflect heightened selling pressure, nudging XAU/USD towards a downward trend. Subsequently, the pair seems to have discovered a semblance of support around the 2975 level, as inferred from recent price consolidation trends. Keep an eye on potential bullish reversal patterns such as a doji or hammer near this support. A formation of any of these engenders a bright prospect for an imminent upswing.
Our scrutiny of the Relative Strength Index (RSI), currently standing at 38.17, provides additional implications. This reading gravitates towards a neutral to slightly oversold milieu. While it aligns with the existing downward bias, it concurrently hints at a possible rebound if it veers towards the oversold territory, adding a layer of complexity to our outlook.
Turning our attention to the blend of Keltner Channels and Chop Zone analyses, we further uncover intriguing features. The pair trades below the EMA 20 middle band, a signal that bolsters the bearish sentiment. Furthermore, the moderately expanded channel insinuates a surge in volatility. The Chop Zone rings true with this high turbulence narrative with consistent red bars indicating a robustly sideways and volatile environment. This volatile state heralds a potential breakout scenario, given that the price closes outside the Keltner Channel and the Chop Zone sways towards neutrality.
Lastly, examining the Stochastic RSI (Stoch RSI), we discern a scenario where the K line (52.57) overtakes the D line (41.44). This bullish crossover could potentially fuel upward momentum, adding yet another divergent outlook to our analysis.
Conclusion and Trading Recommendations
The mixed signals emerging from our technical analysis accelerate the intrigue surrounding the XAU/USD pair. The prevailing downward trend aligns with the EMA 20 and RSI readings, yet the prospects for an uptrend cannot be disregarded, given the potential for bullish reversal patterns near the 2975 support level and the recent Stoch RSI crossover.
Traders are recommended to adopt a deliberative stance, waiting for robust signals such as bullish reversal patterns or a convincing close outside the Keltner Channel signaling a potential breakout.
Time Frame Analysis
Analyzing the 1-week, 1-day, and 4-hour time frames reveals the following:
- 1-week: Mixed trends with a longer-term consolidation range observed.
- 1-day: Slightly bullish tendencies suggested by long-term support zones.
- 4-hour: Bearish momentum continues, yet signs of potential reversal are emerging.
Given this context, potential entry points based on the analysis of indicators can be summarized as follows:
- Buy Entry Point: 2980, Take Profit Point: 3020, Stop Loss Point: 2965.
- Sell Entry Point: 2965, Take Profit Point: 2950, Stop Loss Point: 2985.
Considering the analysis combined with the current market dynamics, a Buy scenario appears more likely given the proximity to key support levels and bullish reversal signals. However, vigilance on bearish indicators is necessary as conditions may shift swiftly.


