

China Chengtong Holdings Boosts ETF & SOE Investments for Market Stability
Tháng 4 7, 2025
Gold vs US Dollar – A Comprehensive Technical Overview Amid Volatile Conditions – 08/04/2025
Tháng 4 7, 2025Market Overview
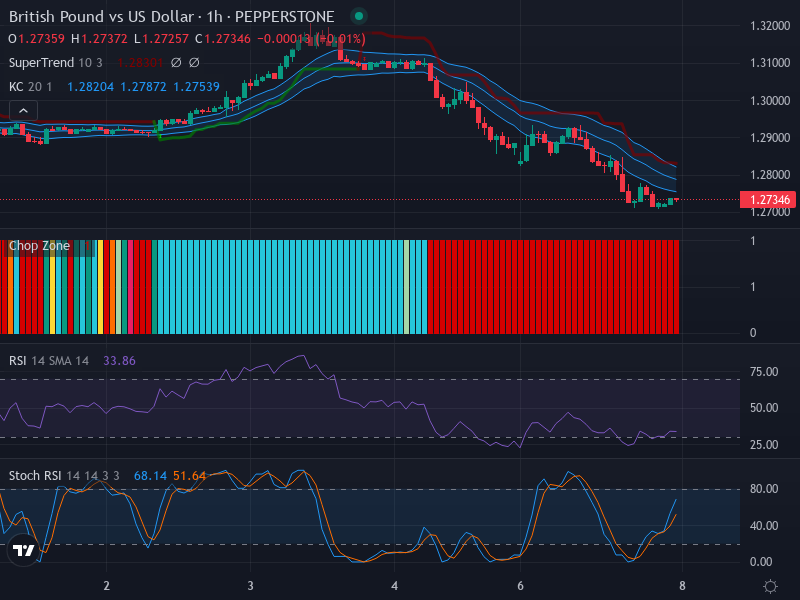
The GBP/USD Forex pair, widely considered a barometer for global economic health, has been expressing a discernible downward trend. This momentum is notable with recently observed candles progressively skewed to lower levels without any foreseeable reversal patterns. Despite the inherent bearish nature of the current market, a potential corrective movement or minor retracement could be on the horizon.
Technical Analysis
The candlestick chart pattern portrays a staunch downward trend with no bullish engulfing or hammer formations to denote the likelihood of a reversal. The price is prompting towards the lower band of the Keltner Channel, a sign of continued bearish pressure. However, this also incites a potential for minor retracement.
Analysing the Relative Strength Index (RSI), a figure of 33.86 currently underlies the market’s lean towards oversold territory. While this data affirms the downward trend, the contrarian nature of the RSI indicator might suggest a potential for price reversal if it crosses below 30 and rebounds. Interestingly, there is no evident discrepancy between the prices and RSI, indicating a strong correlation between the two variables.
The Keltner Channels, coupled with an EMA 20, reiterate the ongoing bearish trend, indicating prices below the middle band. Reinforcing this trend is the Chop Zone indicator, consistently exhibiting red bars and thus ruling out the possibility of a sideways movement and confirming the continuation of a trending market.
In another light, the Stochastic RSI (K=68.14, D=51.64) reveals a somewhat contradictory stance. With the K line being above D, slight bullish momentum is present, although it is approaching potential resistance. The recent crossover further suggests a short-term upswing against the prevailing downward trend.
Conclusion and Trading Recommendations
Careful observation of market movement is key in light of the prevalent bearish pressure suggested by the majority of indicators. The minor bullish signs portrayed by the Stochastic RSI should be monitored for potential retracement or short-term reversal. Traders could seek short positions, but should maintain vigilance to act upon possible bullish signals triggered by any approach into an oversold position and a subsequent bounce back from the RSI.
In summary, the analysis over multiple time frames suggests the following:
- The 1-week timeframe shows a strong bearish trend with no clear reversal signals.
- The 1-day timeframe indicates a continuation of the downward movement, with minor potential for retracement observed.
- The 4-hour timeframe supports the bearish outlook, yet hints at short-term bullish corrections might emerge.
Potential trading entries for the 1-hour timeframe based on this analysis could include:
- Buy Entry Point: 1.2300, Take Profit Point: 1.2400, Stop Loss Point: 1.2250.
- Sell Entry Point: 1.2200, Take Profit Point: 1.2100, Stop Loss Point: 1.2250.
Considering the overall market dynamics, a Sell scenario appears more likely at this juncture due to prevailing bearish indicators, but traders should remain alert for any bullish signals primarily driven by RSI readings.


