Euro vs US Dollar – Analyzing The Bearish Trend & Potential Reversal Signals – 25/03/2025
Tháng 3 24, 2025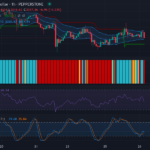
Unraveling the Stalemate: An In-depth Analysis of Gold vs US Dollar In A Tug Of Indecision – 26/03/2025
Tháng 3 26, 2025Market Overview
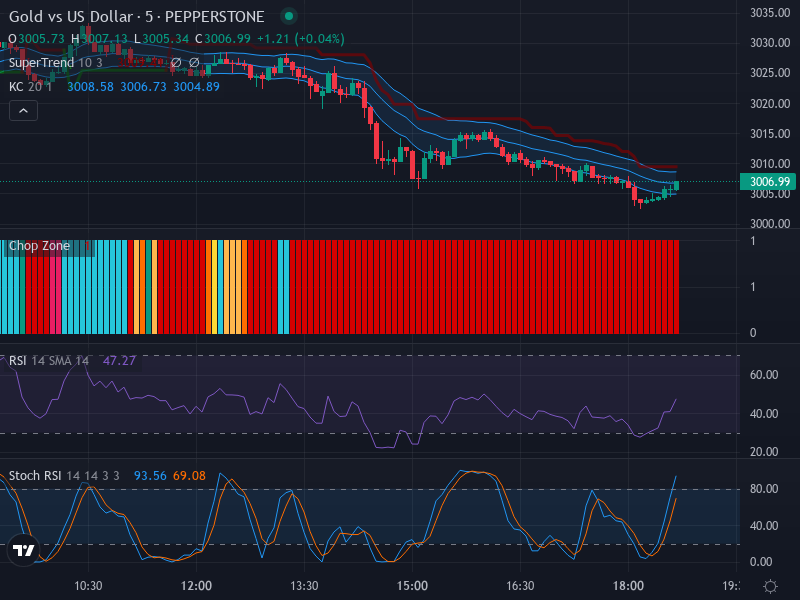
The Gold-US Dollar pair, commonly referred to as XAU/USD, has been ensnared in a bearish grip, as evidenced by a series of descending candlesticks present on the chart. The downtrend does not show any significant signs of bullish reversal patterns, such as a bullish engulfing formation, thereby painting a somber outlook in the near term. A semblance of stability, however, could be lurking around the 3006.99 mark, which could serve as a long-standing support zone.
Technical Analysis
A deeper dive into the XAU/USD forex pair chart reveals several technical elements steering its market movements. The Relative Strength Index (RSI), floating at 47.27, points to a neutral market environment. This positioning does not hint at overbought or oversold scenarios, and instead seems to echo the market’s set of indecisiveness around the existing support zone.
The application of Keltner Channels further substantiates the bearish trend, with the price primarily hovering within the lower half of these channels. The expanding breadth of the channels, on the other hand, alludes to potential market volatility and turbulence on the horizon. The supporting Chop Zone indicator corroborates the sideways movement within an overriding bearish market structure, without any discernible signs of impending breakouts.
Furthermore, the Stochastic RSI, a momentum oscillator that compares the RSI value to its high and low over a defined period, may be signaling a potential shift in the short-term market temperatures due to a bullish crossover, as the K line at 93.56 surpasses the D line at 69.08. This does, however, occur in overbought regions, which call for a more cautious interpretation.
Conclusion and Trading Recommendations
While the broader scenario exudes a bearish sentiment, there are observable signals for short-term recuperation or a minor price bounce potentially at the support level of 3006.99. Traders should keep a close eye on the behavioral changes in the price standings around this critical support zone. Possible short-term buy opportunities might surface if the price starts showing signs of an upward correction.
Risk Disclaimer
This analysis should be viewed as informational and is based on data available at the current time. Forex trading involves substantial risks, including complete possible loss of funds and other losses and is not suitable for all members. Remember that past performance is no guarantee of future results or returns. The author bears no responsibility for any trading losses you might incur as a result of using this data.