

Stock Market Trends for April 2025: Insights on Apple, JPMorgan, Palantir, and Caterpillar
Tháng 4 4, 2025
US Dollar vs Canadian Dollar: Discerning Potential Reversal Amid Overbought Conditions – 05/04/2025
Tháng 4 4, 2025Market Overview:
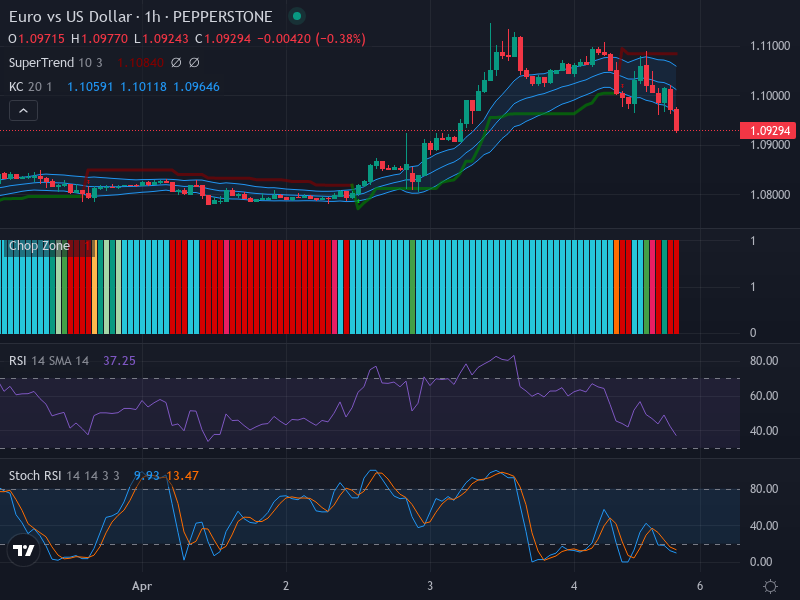
The European currency, when paired against the U.S. Dollar (EUR/USD), has shown a notable downward drift recently. This brief rupture in the overall bullish trend on a grander scale transpires amidst significant selling pressure. Let us delve into a detailed dissection of this recent run by analyzing some critical technical indicators to gauge the potential future movements of this currency pair.
Technical Analysis:
Numerous bearish candlesticks have led to the break-down outside the lower Keltner Channel, reinforcing the aggressive selling sentiment among traders and solidifying the market’s bearish trajectory. The decline has guided the pair towards the potential support zone on the southern side of 1.0920, which suggests the potential exhibition of a bullish retracement should buyers re-enter the scene.
Moreover, higher-level resistance, which can also be designated as the “price surge zones,” may come into play around the 1.1018 mark, lying near the upper Keltner Channel. This resistance level, coinciding with the upper limit of this channel, might be instrumental in transforming the market psychology, thereby determining the future course of this currency pair.
Our investigation into the Relative Strength Index (RSI) reveals a value teetering at 37.25, dangerously close to breaching the oversold boundary. This not only underlines the sustained bearish momentum but also chimes with the potential buying opportunity should the index drop further before a rebound.
Now let’s turn our attention towards the Stochastic RSI (Stoch RSI), another powerful momentum oscillator. Currently, the K and D lines stand at 9.93 and 13.47, respectively, both falling within the oversold precinct. The absent crossover alludes to a persisting bearish stance. Though the readings point towards a continuity of the downturn, it might also signal a prospective reversal if a crossover makes an appearance on the horizon.
Conclusion and Trading Recommendations:
Zooming out to evaluate the various temporal compartments of the EUR/USD pair reveals an interesting blend of cross currents. The wider trend visible on a weekly basis sports an optimistic flavor with an inclination for bullish bias. On the other hand, the pair has been consolidating on a daily scale with enhanced trading volumes.
This combination of contrasting trends and technical signals throws into sharp relief the current situation’s complexity. Though the downward momentum offers short-term trading opportunities, the possibility of an upward turnaround needs to be considered warily due to overreaching into oversold territory. It’s advisable for traders to adopt a balanced ‘wait and see’ approach in the short term and look out for a potential bullish reversal for longer time frames.
Trend Analysis:
A succinct review of the 1-week, 1-day, and 4-hour time frames yields the following insights:
- The 1-week trend exhibits a bullish inclination overall, suggesting a longer-term bullish momentum may still be in play despite current bearish movements.
- The 1-day chart indicates consolidation and varied trading volume, suggesting indecision among traders and the possibility of a break in either direction.
- The 4-hour trend shows a strong bearish posture, emphasizing the selling pressure currently dominating the market.
Based on these analyses, we can pinpoint potential entry points on the 1-hour time frame that align with these trends. For a Buy scenario, entry could be initiated at 1.0945 with a Take Profit at 1.0985 and a Stop Loss at 1.0920. On the flipside, for a Sell scenario, one might enter at 1.0910 with a Take Profit at 1.0870 and a Stop Loss set at 1.0930. In conclusion, given the bearish trend confirmed by current analysis, a Sell scenario appears more likely to unfold in the near term.


